Dang…it’s wet and cool this summer!
Welcome back! Sorry for the long delay in weather related ramblings but I was busy taking the NY bar exam for fun. Why not right? What harm can being admitted to a third state cause? Anyway, I’m back and full of weather talk. So here we go.
As many of you have noticed it has rained quite a bit this summer. For those of you who were running with me on Sunday it rained on us enough to satisfy an entire month of water needs!
But how wet has it been?
The short answer- Historically wet!
For example, Albany, NY set a record with 9.91 inches of rain. The previous record of 9.37 inches was set in 1871! Albany also had average July temperature of 68.3 degrees which was the third coldest on record. BRRRR!
Of course the next question any true famous internet skier would ask is: what does that mean for winter? While the appropriate response is buy me some beer or show me a naked picture of your sister and I’ll tell you. However I’m too nice for that (and I already have pictures of your sister…woof.) Plus I’m bored at work. Therefore, I’ll just tell you.
Sticking with Albany, the other wettest Julys are:
1871, 1850, 1848, 1863, 2005, 2007, 1975 and 1970.
The other coolest Julys are:
1992, 2001, 1971, 1976, 1824, 1875, 1978, 1965 and 2001.
Interestingly, there is not ONE other year where there was a record cold July AND and record wet July. That’s part of what makes this July historic. It also has to factor into our interpretation of what this July means for the upcoming winter.
The Mt. Mansfield snow stake, showing total snow depth, for the above years shows:
The Wet Years:
The Cold Years
Looking at the snow stake data, it appears that having a cold July is more likely to lead to an above average depth on Mt. Mansfield. The effect of a wet July is hard to judge because there is simply not enough data to look at. Additionally, we can rule out 2007 and 2005 as good analogies because both those winters were not el nino winters, and this winter an el nino pattern will prevail.
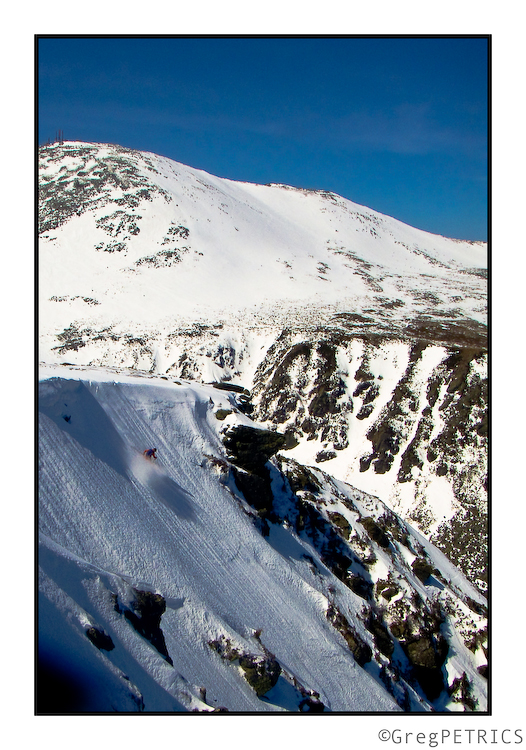
Greg and I are competing to see who has the best collection of photos that make you go “WTF?!” We’re taking submissions as well, so send em on in!
A sample entry:
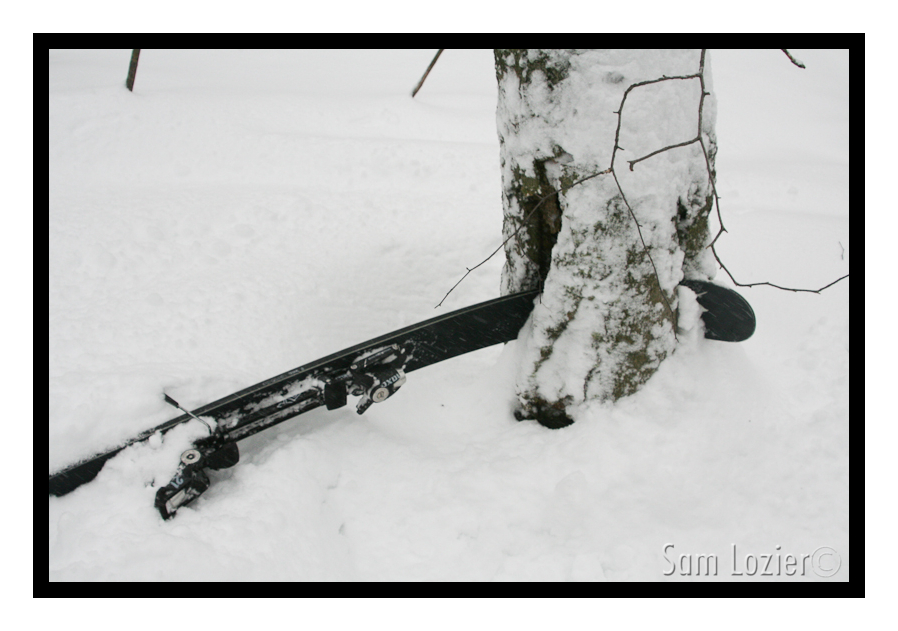
The rest of my entries are HERE
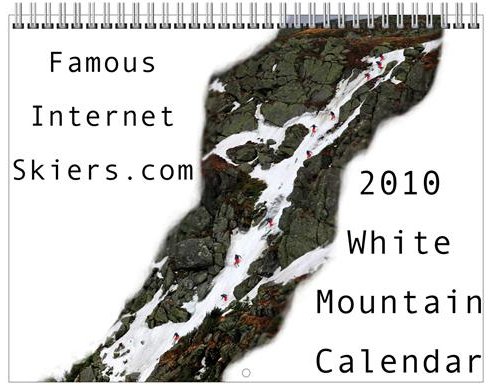
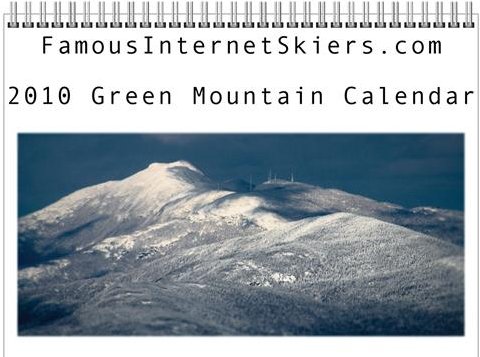
New calendars are getting printed
We just sent the proofs over to the printer for the new calendars. We have a White Mountain edition and a Green Mountain edition. Click one of the following to view and pre-order each (will ship on or before August 21):
|
 |
Google Earth’s historical imagery
I just found out about Google Earth’s historical imagery feature. Needless to say the first thing I looked for is winter-month imagery. While there don’t seem to be many winter satellite images for the mountain regions of the Northeast, there are a couple of May views. Here’s one of The Ravines from May of 1994 (click for a larger view). Was this historically snowy, or just about average? Looks pretty good to me right about now:

I did a lot of flying around last night checking things out. Already building up a list for next year!
I guess if we can’t have winter year round in New England, the best we can do is look at satellite pictures of it!
What does a historically cool June and early July mean for Winter 2009-2010
As the north country endures another round of upper level low induced summer suckage you have to wonder exactly what that means for the upcoming winter.
First the answer is it has nothing to do with the upcoming winter. Any historical stat – espically with winter is just an expression of what happened in the past. As anybody knows – if you flip a coin 50 times and it lands on heads 50 times that doesn’t mean it will land on heads the 51st time. Now you say-well it should tell you that something is up with the coin and you can expect heads…and you might be right. Perhaps the coin is weighted funny. Perhaps you’re playing a cheater. Who knows. Well the same goes for the weather. Looking at historical data should only tell you that something is afoot. It should give you a guide for watching how things develop.
And so with that crap out of the way let me begin.
I noticed that the Artic Oscillation (AO) is extremely negative and has been so since early june.
)
In fact it’s been strongly negative. Since 1950 only seven other years have featured a june with such a strongly negative AO.
They were: 1951, 1957, 1958, 1982, 1987, 1997 and 1998.
So taking those years I figured lets look at what Mt. Mansfield shows as snowfall for the winter following those years.
Sadly examining this snow stake data is inconslusive. Early years showed a slightly below normal snow depth and the later years show a slightly above average snow depth. Clearly no conclusion can be drawn.
Perhaps we can draw some conclusions regarding what the weather might be based on comparing the years above with the AO in the corrseponding winters.
As you can see from the chart below, A negative AO generally leads to below average temperatures for the East and North east when the Negative AO occurs in J/F/M.
)
So what did these years have for the AO? (Numbers are D, J, F, M)
51/52: -1.9, -.85, -.4, -1.9
57/58: .8, -1.4, -2.2, -2.5
58/59: -1.67, -2.013, 2.5, 1.4
82/83: .967, 1.359, -1.806, -.567
87/88: -.534, .265, -1.066, -.197
97/98: -.071, -2.081, -.183, -.254
98/99: 1.353, .110, .482, -1.492
Looking at these numbers again is not conclusive BUT they do show that 75% of the time these winters exhibted a negative AO which is a good thing for our temperatures.
With a building “west based” el nino, which leads to cooler east coast temps the best guess at this time is that the signs point to a cool winter. Wish I could say all signs point to constant bombed out coastal lows but that’s reality!

-
Search
New Comments
Surfing Safari on Burlington's Booth Street | Seven Days said: “[…] lights and snapped away. Here’s a...(read more)” about Surfing the Flood
macbook repair seattle said: “macbook repair seattle Let’s get it started...(read more)” about Let’s get it started
Greg said: “Thanks for all this great info. And...(read more)” about Skiing Mt. Colden’s Trap Dike
Greg said: “Definitely late, but always welcome!” about Skiing Mt. Colden’s Trap Dike
Bob said: “[* Shield Security plugin marked this comment...(read more)” about Skiing Mt. Colden’s Trap Dike
Regular paint Maintenance said: “Regular paint Maintenance Behind The Schuss(ic) :...(read more)” about Behind The Schuss(ic)
The 2012-13 Ski Season in Photos #13 | NY Ski Blog said: “[…] tweeting about big Memorial Day snow...(read more)” about pow
ml242 said: “LuckyLuc and MadPat on the same day?...(read more)” about Deep Cover Anthropology
Twitter Feed
-
Categories
- Skiing (438)
- Weather (188)
- WTF (5)
- Quick Update (173)
- Full Trip Report (165)
- WebiGNARs (45)
- General Interest (38)
- Site News (27)
- Summer (59)
- Hiking (26)
- Swimming (15)
- Climbing (13)
- Longboarding (3)
- Whitewater Kayaking (2)
- Mountain Biking (1)
- SPA (16)
- Gear Review (8)
-
Archive
- October 2018
- June 2017
- November 2016
- October 2016
- March 2016
- January 2016
- October 2015
- February 2015
- January 2015
- December 2014
- November 2014
- October 2014
- September 2014
- July 2014
- April 2014
- March 2014
- February 2014
- January 2014
- December 2013
- November 2013
- October 2013
- September 2013
- August 2013
- June 2013
- May 2013
- April 2013
- March 2013
- February 2013
- January 2013
- December 2012
- November 2012
- October 2012
- September 2012
- August 2012
- July 2012
- June 2012
- May 2012
- April 2012
- March 2012
- February 2012
- January 2012
- December 2011
- November 2011
- October 2011
- September 2011
- August 2011
- July 2011
- June 2011
- May 2011
- April 2011
- March 2011
- February 2011
- January 2011
- December 2010
- November 2010
- October 2010
- September 2010
- August 2010
- July 2010
- June 2010
- May 2010
- April 2010
- March 2010
- February 2010
- January 2010
- December 2009
- November 2009
- October 2009
- September 2009
- August 2009
- July 2009
- June 2009
- April 2009
- March 2009
- February 2009
- January 2009
- December 2008
- November 2008
- October 2008
- April 2008
- March 2008
- February 2008
-
Friends of F.I.S.
About Us:
We are a group of powder hungry, east-coast-bred, world-traveling skiers and riders who Earn Our Turns to bring you the best stoke a click-of-the-mouse can buy.We hope our adventures inspire you to Earn Your Turns as well!
LEARN MORE

Latest Weather
When one makes meatballs, one must begin with quality meats: ...
Read more in: Meatballs! (read more)