¡Viva Winter!
The city of Las Vegas has starred in major catch phrases like “Viva Las Vegas” and “What happens in Vegas, Stays in Vegas” and “Vegas, Baby, Vegas.”
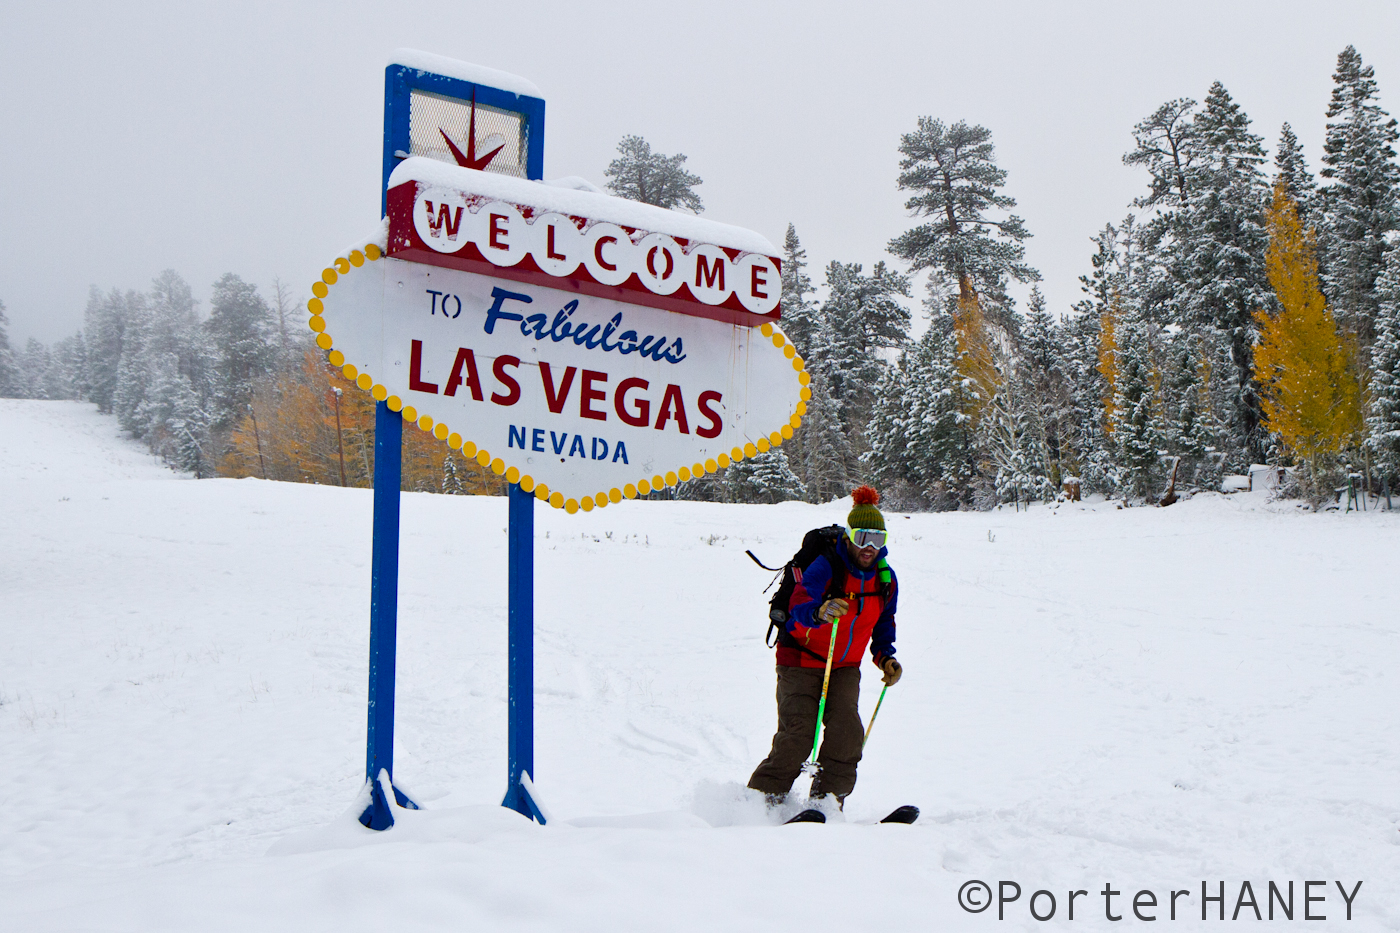
“Welcome to Fabulous Las Vegas” is the iconic sign that welcomes most visitors on their first arrival to Sin City. The sign is reputed to be one of the most photographed signs in the world and has inspired the major tag-lines of all Las Vegas’ most famous sayings.
With such a reputation, Jimmy and I decided to see if we could catch the lovely sign in action, as it welcomed Winter into the city for the first time this year. This rare event happens just once a year, but it would be just our luck that we happened upon it at the right time.
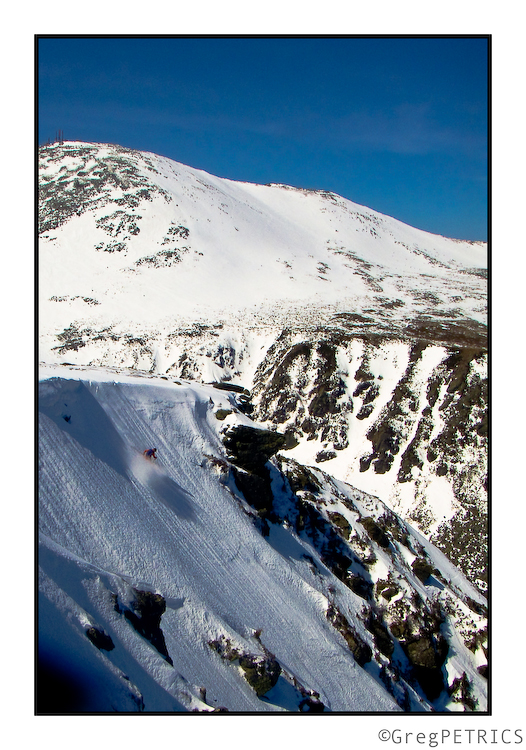
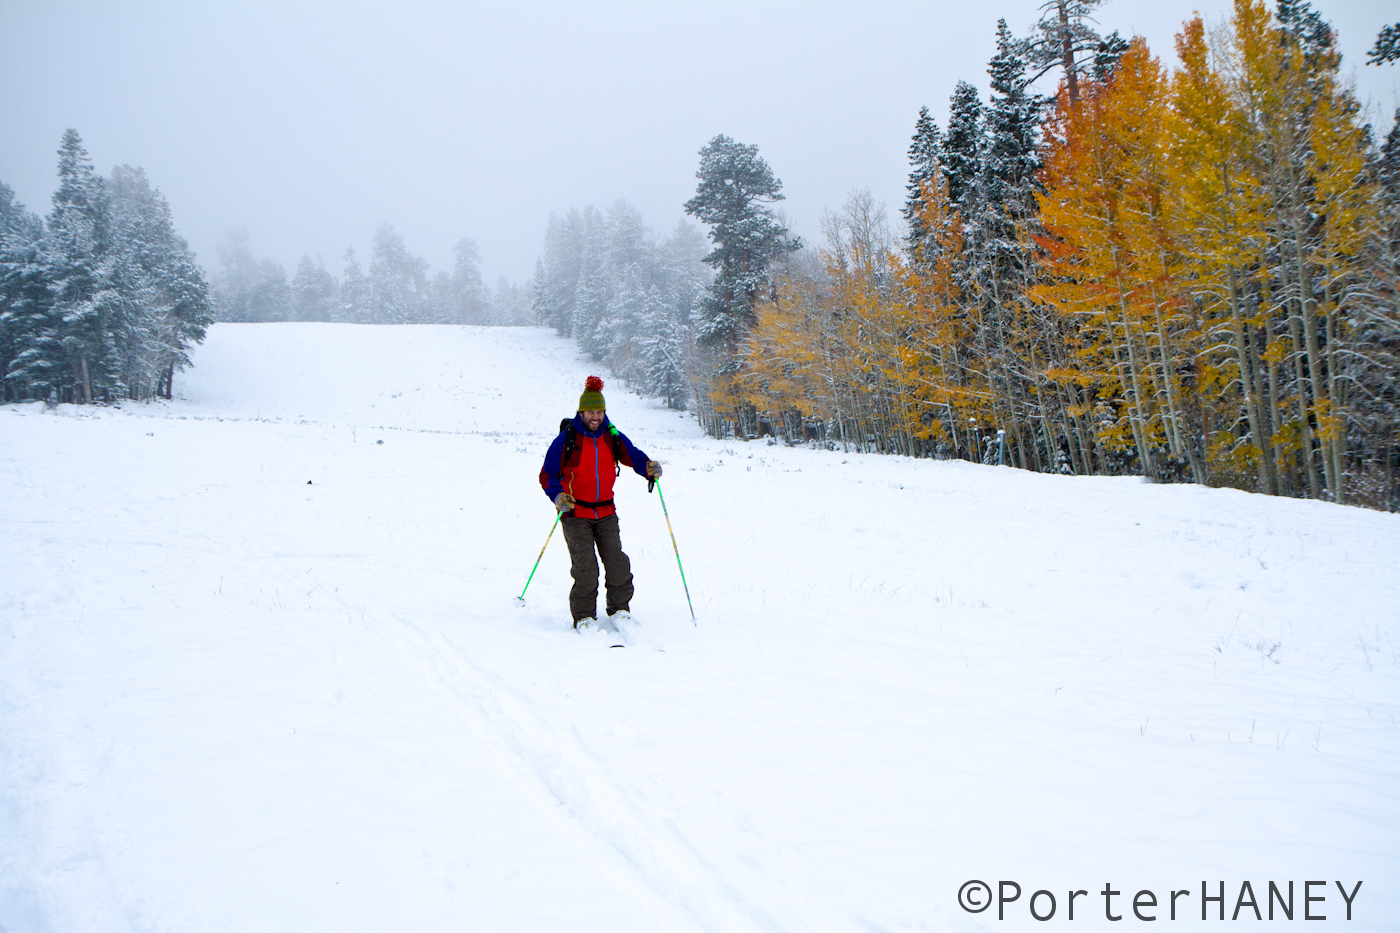
We adjusted the famous catch phrase and created our own Famous Internet Skiers versions: ¡Viva Winter! As we drove up to the ski area about an hour north of town, we found plenty of snow to scratch around on for our first turns of the season.
Jumping out of the car we hiked up the hill, strapped the skis on and took the first tentative turns of the season.
On the way down, we realized the Fabulous Las Vegas sign was doing a great job welcoming Winter to town. We decided that it’d be rude not to do exactly the same thing ourselves. So we schussed by the sign screaming ¡Viva Winter!
Here’s hoping you have a wonderful 2013-2014 ski season and that your first turns are right around the corner.
2013-2014 Northeast Winter Outlook
I know. I said I’m not doing winter outlooks anymore. Well, I say a lot of things. Why start following through on the them now?
The reason I bagged winter outlooks is simple: I felt that for the Northeast mountains, winter outlooks don’t really predict anything. My intuitive sense after doing years of outlooks and studying the snow in the N/E mountains was that the macro weather patterns we can predict with decent certainty in the fall, don’t actually correspond to the amount, frequency, or quality of snow we see in the winter. Sure, ENSO states (which is about all we can predict with certainty) might correspond reasonably well to the temperature in Boston, or the amount of rainfall in Philly, or most likely the amount of snow in California, but does the ENSO state really lead to more or less snow in Vermont? Or the ADK? Or the Whites?
After talking about it with Greg, who is a) a bigger math nerd than I am, and b) a fan of winter outlooks, we decided that best winter outlook would be a re-analysis of the above hypothesis merged with a discussion of the current ENSO state. This follows on the heels of Greg’s EXCELLENT re-analysis of the yearly average snowfall on Mt. Mansfield.
So here we go.
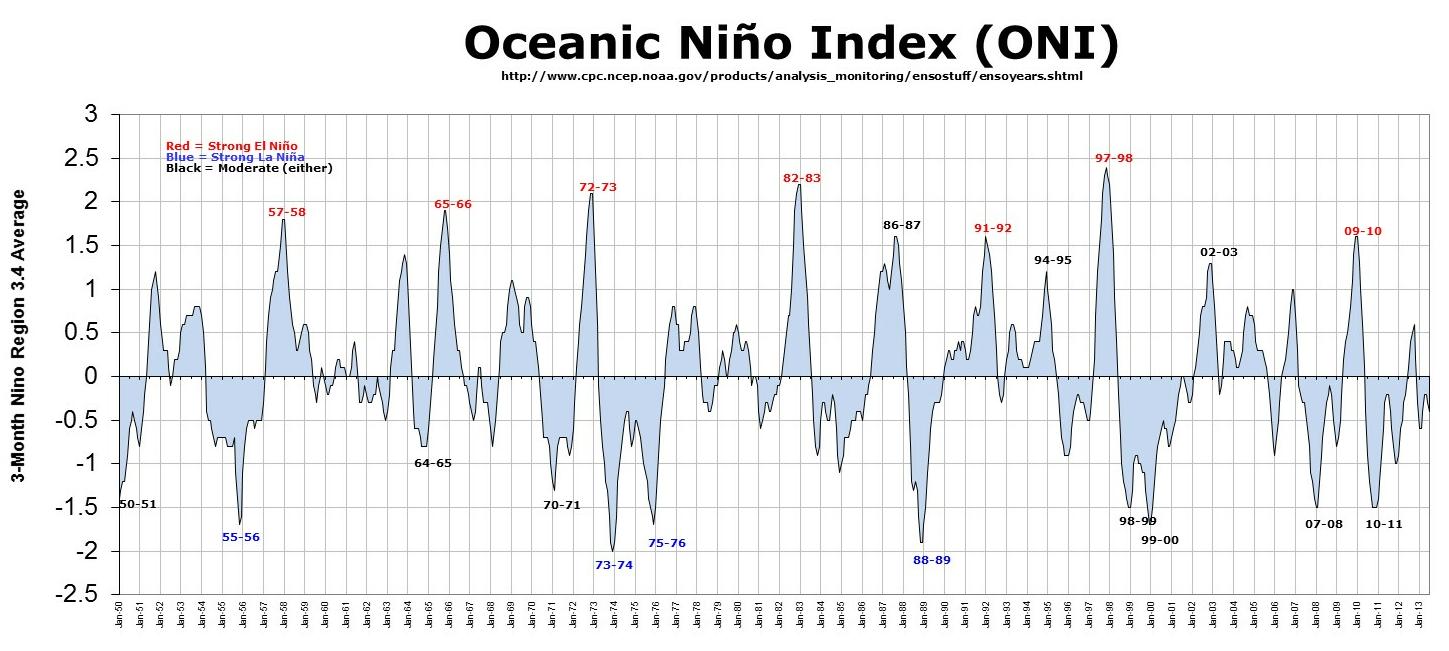
ENSO. What is it? ENSO stands for El Niño/Southern Oscillation and it is a global weather phenomenon. As exaplained by NOAA’s Climate Prediction Center (when it’s not closed):
The term El Niño refers to the large-scale ocean-atmosphere climate phenomenon linked to a periodic warming in sea-surface temperatures across the central and east-central equatorial Pacific (between approximately the date line and 120oW). El Niño represents the warm phase of the El Niño/Southern Oscillation (ENSO) cycle, and is sometimes referred to as a Pacific warm episode. El Niño originally referred to an annual warming of sea-surface temperatures along the west coast of tropical South America.
NOAA’s Climate Prediction Center, which is part of the National Weather Service, declares the onset of an El Niño episode when the 3-month average sea-surface temperature departure exceeds 0.5oC in the east-central equatorial Pacific [between 5oN-5oS and 170oW-120oW]. (CPC)
La Nina, is essentially the inverse. It’s the “periodic cooling of ocean surface temperatures in the central and east-central equatorial Pacific that occurs every 3 to 5 years or so.” (Id.)
The hell does that have to do with the Northeast? (good question, see paragraph 2 supra). Generally, the basic concept is that the state of the equatorial pacific influences global weather patterns through a complex chain link of interactions. I’m simplifying but, warm sea water influences greater tropical convection and rainfall. The enhanced cumulonimbus convection affects the wave pattern in the upper atmosphere. Think about it like a rock being dropped into a pond only upside down. The convection enters the upper atmosphere and alters the natural wave state. The expanding “ripples” don’t make it that far but the energy produced has global influences in a wave pattern that when acted on by the earth’s rotation and naturally occurring jet streams results in fairly stable repeating patterns of highs and lows across the world. (Seriously, read more) For anyone who knows anything about partial differential equations, the ENSO state is a broad initial condition that increases the probability of one of a small(er) set of forward-difference “attractor” solutions.
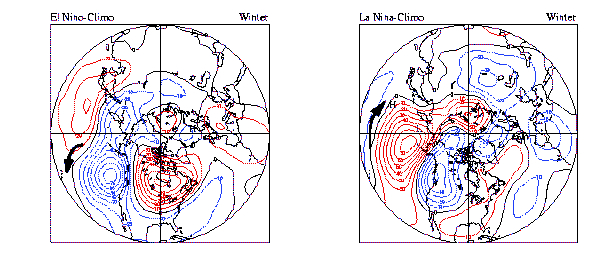
Generally these are the wave patterns over Nor. America:
So what is the ENSO state?
Currently SST departures for the critical Nino 3.4 region are at -.2C which places the ENSO state squarely in the “neutral” range. Current three month running Oceanic Nino Index (ONI) for 3.4 region is -.5 which is the border of La Nina.
During the last four weeks, SST’s were below average in the eastern pacific and above average in the western pacific with the anomalous value of these SST’s weakening (moving towards average). The slope of the thermocline (thin boundary of water separating upper ocean from deep stable ocean) can be used to signal the approaching enso state. It’s flattest before warm episodes, and steepest before cold episodes. Currently it’s in the middle of ranges. This further indicates that we are heading for ENSO neutral conditions.
The CPC’s Probabilistic ENSO outlook for september mirrors this real data and gives us a 60% chance at seeing ENSO neutral conditions, a 25% of seeing La Nina conditions and a 15% chance of seeing El Nino conditions develop for the December, January February time period. (Similar chances for NDJ and JFM). The International Research Institute for Climate sees ENSO neutral conditions persisting with equal chances for the ONI to persist around -.5 (its current state) and +.2.
Last year we were in a generally neutral pattern after two years of moderate La Nina conditions:
But again, does the ENSO state matter? Well maybe.
After a great saturday hike and a few beers Greg and I decided to find out.
First we compiled data on the annual snowfall on Mt. Mansfield, the average ONI for the snow season, the average ONI for December, January, February, the average ONI for November – April, the January, February to March NAO. We also decided that “annual snowfall” didn’t really tell us whether Mansfield had a “good” or “bad” year. We figured it’s not the total snow that Mansfield gets that makes or breaks a year. Rather, at some level, it is the frequency of new, large(ish) snowfalls. The idea being that if it were to dump 3 feet three times a year and do nothing in between that wouldn’t really make for great skiing. Sure there would be three great weekends, but rock-hard ice in the interlude. Contrast that with a winter where it snows 6+ inches a dozen times. In the latter, you’re getting frequent powder skiing and a stable, building snowpack. So thus we went back through the Mansfield data and determined the number of 6-inch+ snowfalls for all the winter seasons.
With all that data we next ran some comparisons.
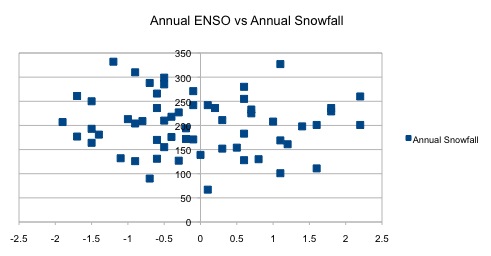
First we compared the ENSO to the annual snowfall.
ENSO to frequency of dumps

Then we broke it down a little more and did the DJF ENSO v. number of dumps

Going a different direction we then took the average NAO values for the winter and compared that to the number of dumps

Then of course we looked to see the comparison between NOA and ENSO

So what does this tell us?
First it seems that there isn’t a direct correlation between the ENSO state and either the total snowfall on Mt. Mansfield or the frequency of snowfall. That alone is a fairly significant conclusion (albeit one that would need more research to conclude with authority). Just about every winter-outlook you read relies on the ENSO state…what our data shows is that the ENSO state may be afforded too much credit.
There does however seem to be some “sweet-spot” towards a weak La Nina. It looks like if a borderline La Nina develops, the probability of favorable snow conditions in Vermont increases.
However, there doesn’t seem to be a correlation for other ENSO states. What we are likely seeing is some third variable at play. Something we haven’t figured out yet; something no one has figured out yet.
Second, the NAO state doesn’t need to be very negative to produce active winters or deep winters. Many people are trained with the mindset that big negative NAO anomalies mean big winters. That may be true in Boston or New York, but it doesn’t seem to be true for Mansfield. However, our data shows that’s not true. Middle of the road NAO values are fine.
These conclusions make some sense when we look at the the prevailing weather patterns associated.
If we go back to the chart above (i’m simplifying what that chart means) we see that in an La Nina year, there is generally low 500mb heights ( representing cooler than normal air) over the Great Lakes and a above average heights (warmer air) over the southeast. In El Nino years, there is generally a large high pressure over the northern center of country and trough-y below average heights in the west and southeast. The boundary between these regions is by and large the favored locations for storms. It sets the storm track if you will. Thus in a La Nina year, the storm track is closer to Mt. Mansfield than it is in an El Nino year. Maybe what we’re seeing is that borderline weak La Nina’s set that boundary juuuuuuuust over Mt. Mansfield. El Nino’s maybe place the boundary too far south. Think 2009-2010. It snowed like 100 inches in Philly and 100 inches in DC. It was fine winter but nothing incredible on Mansfield (6 6+ snows, 202+ total inches).
A similar reasoning applies to the NAO state. In a big negative NAO anomaly, there can be a deep cold pool over the northeast that drives the storm track south of the mountains. (See the suppressed winter of 2009-2010) and thus it makes sense that Mansfield sees the most active and profitable winters when the NAO hovers in the slightly negative range. Or at least when the NAO transitions from deeply negative to positive and back again as our best chances for big snows usually come with NAO transitionary phases. Sadly you can’t really predict the NAO very well with anything more than a few weeks lead time.
So what does that mean for our winter?
Well it means that with a trend towards ENSO neutral conditions, and a number of models favoring ENSO neutral/slightly negative conditions, there is a favorable signature going forward for an “average” winter. The mean for all ENSO neutral winters data is about 5-8 6+ snowfalls and around 200 inches at the stake with a maximum average snow depth in the mid-80s. I’m not saying we’ll see an average winter because of the ENSO state. Our research shows that there isn’t a direct relationship, and trying to peg what the probability of any given winter based on ENSO is non-conclusive. Rather I’m saying that for some reason, when the ENSO state is neutral, Mt. Mansfield historically has had “average” winters.
[Once the goddamn government starts working again, I’ll get you some temperature composite anomaly data to compare these years]
Now, I could try to slice and dice years to find two or three comp years. For example, September has seen below average temperatures – so I could try to find ENSO neutral years with cool septembers. Or I could find years that matched other teleconnections (QBO peak, -NA), +PNA, -EPO)…but the more you slice and dice, the smaller your sample size, the more likely anything that happened in your chosen year(s) was simply due to chance.
So, while ENSO doesn’t have a great degree of correlation, the best we can say, is based on the data we’ve looked at, there are favorable signs heading into winter 2013-2014 for average snow depths on Mt. Mansfield and average activity level.
We’d like to continue this research with snowfall data from other N/E mountains – like Mt. Wash, the ADK, and anywhere else we can get reliable data from. We need to expand the sample size and get a broader picture for what is happening at other mountains before we reach any solid conclusions vis-a-vis the correlations between ENSO/NAO/N-E Mountain Snows. Next summer we probably will. But in the meantime, don’t forget what they say about winter in the arctic: it’s gonna be cold…it’s gonna snow…it’s gonna be windy. Duh. A lot of our favorite places to ski are effectively in the arctic due to altitude:latitude conversions. That should tell you something.
“We’re open, but don’t get out of your car,” NPS
It’s been an interesting week since the National Park Service closed the National Parks due to the U.S. Government being unable to approve a budget for them to operate under. I wrote about this issue earlier this week – highlighting park mismanagement at Death Valley National Park a few weeks ago, and also the closing of Red Rock Canyon National Recreation Area. Since then a whole slew of other park related issues have arisen.
Grand Canyon Park Rangers are blocking access to the Colorado River to permit holders who’ve already paid to use the Grand Canyon National Park as their public right of way to the always public Colorado River waters. You see, the water is always public anyone can float on it at any time, but if you use any of the banks within the park you’d be violating the closure.
Visitors to Cooke City, Montana a private area inside Yellowstone National Park are trapped. The only way to access Cooke City is through the Park, and with the Park closed the visitors are marooned there. I hope they’ve got enough food stockpiled to outlast Congress’ current brawl.
Interestingly enough, this week, when some politicians saw what poor publicity it was to close National Parks, a slew of funders came out of the woodwork to piecemeal open the parks back up, including state budgets, private individuals, and even lone-wolf municipalities. This part by part reopening of the Government isn’t the right solution, but hopefully it moves towards a wholesale reopening of the Parks.
We decided to go snoop around Zion National Park, the closest Park to Las Vegas, to see what this prolonged closure was doing for the Park. By all accounts probably nothing at all was happening, but my curiosity got the best of me. We drove up the night before and setup shop on Gooseberry Mesa for for an evening of steaks on the campfire and Backgammon.
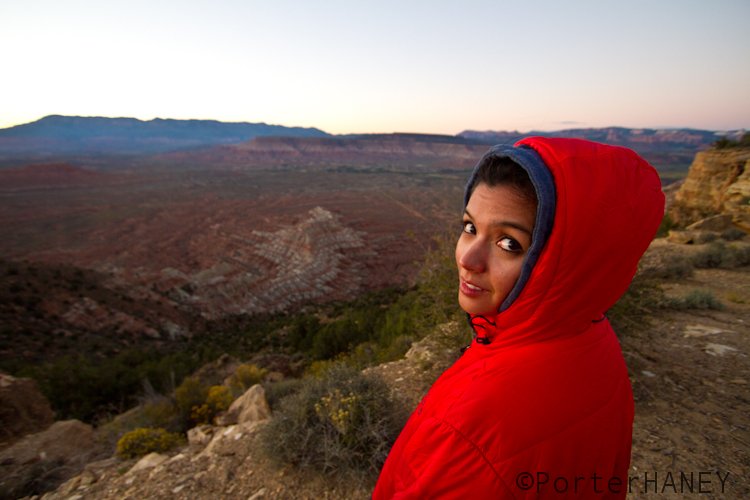
Jeana enjoying the sunset with Zion National Park in the distance.
In the morning we headed up the road towards Zion. The Park is typically very crowded with visitors, tour busses, campers, and a few recreaters that even leave the pavement! We were prepared to see the normal slew of visitors stacked up at the gate being turned away but when we got there, we saw a lone ranger working the entrance gate, and no tourists hanging around. Zion is unique in that it houses a Route 9, a thru road from Virgin/Saint George, Utah that accesses Southern interior parts of the state like Bryce and Escalante (also closed). It appeared as if the Route 9 was in fact open, even if Zion was closed.
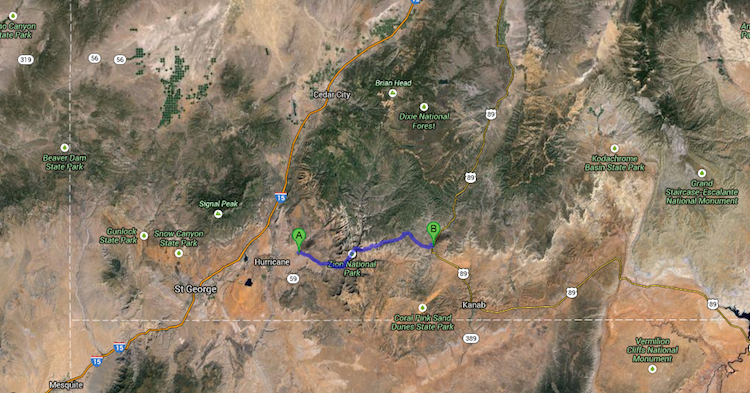
Route 9 traversing Southern Utah through Zion National Park.
We drove up the Ranger station and exchanged pleasantries. He insisted that he was quite sorry that the park was closed, and we apologized that our government had put him in such an awkward position of manning a closed park. He handed us a small printout that read “FEDERAL GOVERNMENT SHUTDOWN,” and instructed us that Route 9 was open, but none of the park services, pull outs, restrooms were open. He reinforced that we were not to stop at any pullout and make our way through the park.
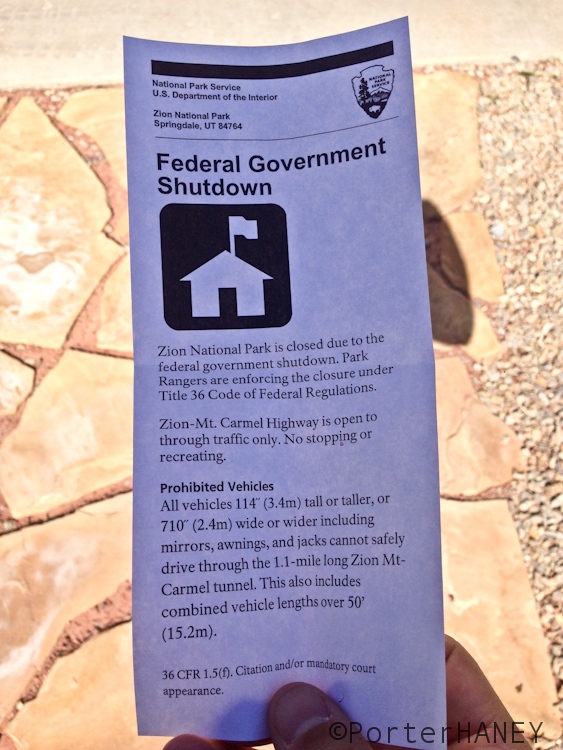
Handout from the National Park Service.
Well, this is kind of funny, the Park is actually closed, but the road through the Park is actually open. Strange. It reminds me a lot of the irregularities of the link about the Grand Canyon above. The river is technically open, but god forbid you use the loading dock on the shore that’s operated by the National Park Service.
So, we decided to drive through the Park road and see what a kind of open, kind of closed park looked like. First things first, we saw some permanent signs for the entrance tunnel on Route 9, that said NO STOPPING. Well, that’s not too strange, they’re always there.
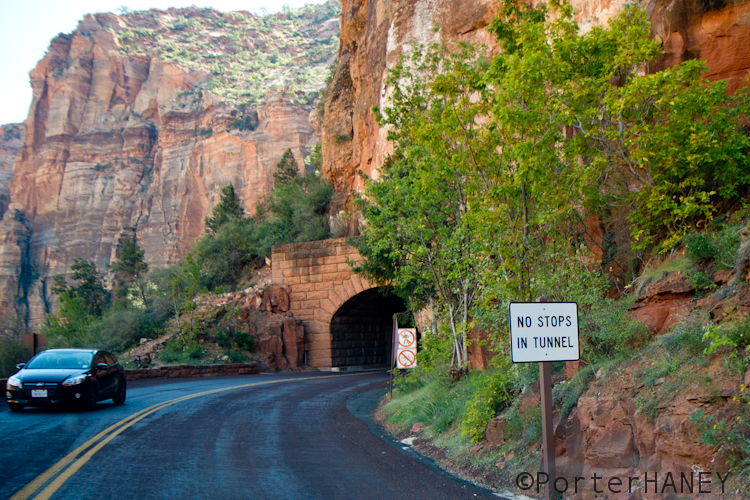
No stopping in the Tunnel!
Making our way through the Tunnel we found that the Park service was indeed upholding their end of the bargain and providing no services what-so-ever, including lighting the tunnel.
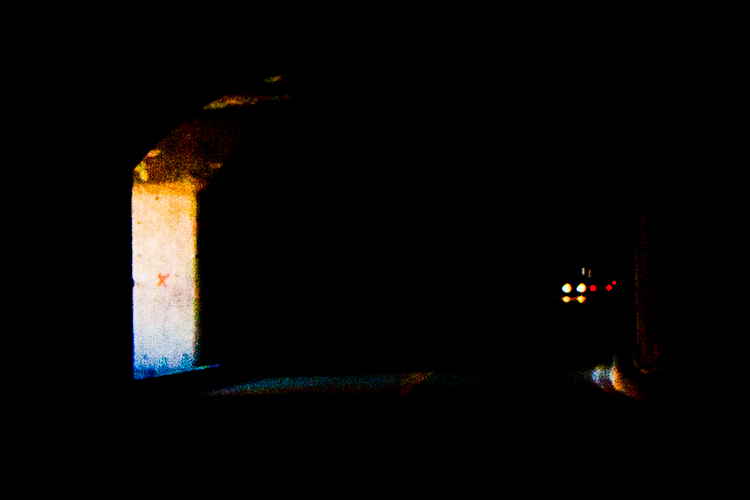
Just joking, this tunnel doesn’t normally have lights.
On accessing the more picturesque side of the park, we saw lots of tourists, doing what they normally do – taking pictures from the driver seat! In fact every picture from inside Zion National Park was taken from the front seat of my Tacoma.
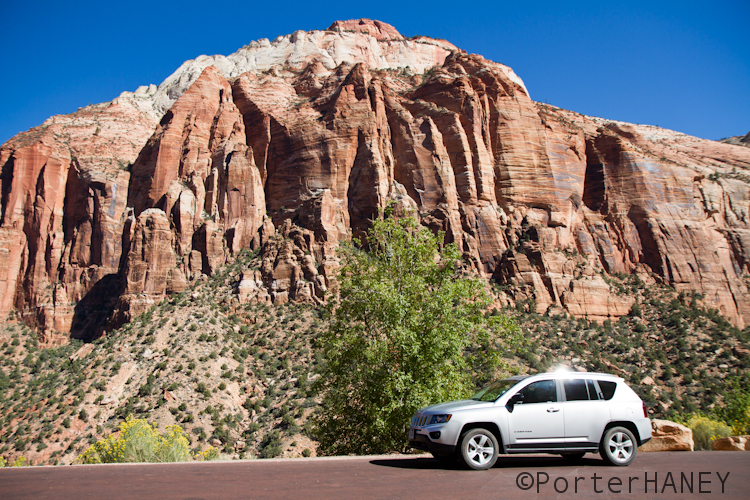
Just a normal drive for this Jeep Compass.
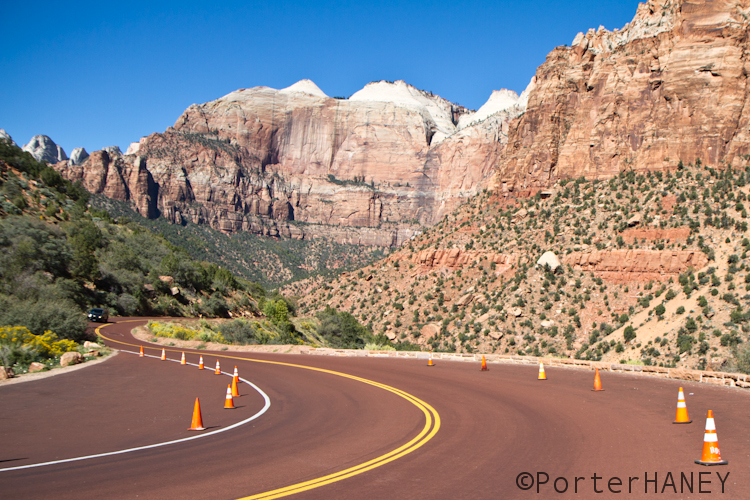
These cones aren’t keeping anyone from getting out of their car!
The Park service seemed to understand that it would be rude to actually enforce the no stopping rule. It was almost comical. They’d laid out a few cones on each pull-out but left plenty of room for cars to pull in and out. The Zion Park Rangers know they’ve got one of the most beautiful parks in the entire world, and they have the rare opportunity amongst their other parks to keep a sliver of their park open during this closure. And, they’re making the most of it. They’re being polite, they’re patrolling the entrance, they’re not charing people to drive the public road, and they’re letting the auto-tourers enjoy the views from their cars.
Here’s hoping the government gets out of it’s own way and resumes the pseudo-functional role it was playing before.
“Sorry, we’re closed,” says the National Park Service
House Republicans are in a never ending arm wrestling match with Senate Democrats and the President. The result of this battle is that they’ve failed to approve a budget for the upcoming fiscal year 2014. When the government fails to approve a budget, their non-essential personnel start getting to take some unpaid time off.
Little did I know, the least essential personnel of the government are the staff that man our National Parks. These park officers were the first public relation stunt to hit the news media this morning after last night’s midnight government shutdown. Claiming they wouldn’t be operating any services at the parks today, they’d not man their Twitter account, nor open their website.
I’ll be honest, I love our National Parks, but maybe more so in theory than in practice. I’ve been to dozens of parks, and even spent a summer working for a concessionaire of Glacier National Park. In short, I’ve worked, lived, visited, and explored almost every park in the West and don’t really feel like they’re living up to their esteemed duties.
I’m going to take a step back and address some National Park issues before I address the current closure that’s been mandated by the Federal Government. If you’d like to read about the current closure, skip to the bottom.
Two weekends ago, I drove to Death Valley National Park from Las Vegas. I left early in the morning, 3:30 AM, with the hope of being at the trailhead to Telescope Peak with enough time to spend part of the day on the summit. I made good time past the Nevada Test Site and was in Death Valley at dawn, and ready to head up the 20 mile access road to the Wildrose Trailhead when I ran into my first road closure. The road closure read, “Closed for Flooding.” Keeping a close eye on our local weather, I knew our last substantive rain out here had been in mid-August, and it was now mid-September. Had this road really been closed for a month? Not to be deterred there were two other access roads, so I started driving to those. Turned out it was the same story there too, closed.
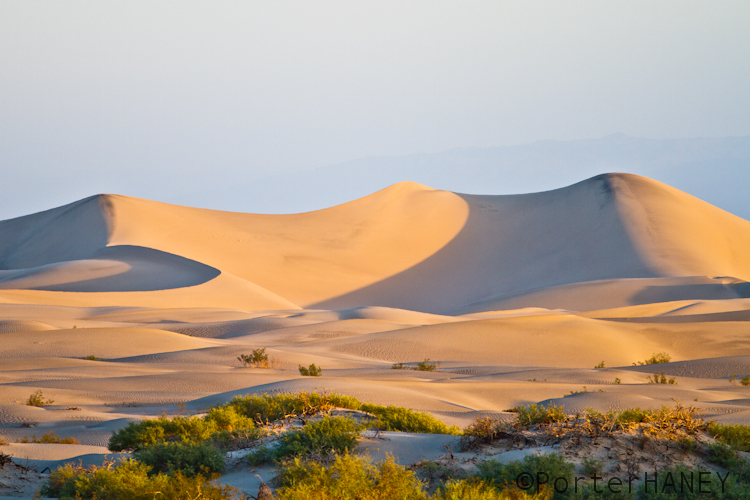
Sunrise at dawn in Death Valley
I made my way back to the visitors center of Death Valley, to see if I could find out what exactly was going on. This is a big park, so it was nearly a 2 hour drive to the visitors center at Furnace Creek.
I arrived at the visitors center, which I’ll mention was a giant, brand new building, in the middle of nowhere, with hardly a tourist there to view their myriad of interactive displays. I walk up to the front desk where a half dozen rangers are drinking coffee and chewing the fat. I cough a bit, to get their attention, and one of them finally asks if she can help me. I said sure, but first she wanted to make sure I’d paid my park entrance fee. Which I had, in a roundabout way, I hold a National All Access Pass, which she thoroughly reviewed with my license. After passing her examination, she asked if there was anything else she could help me with besides accepting my park entrance fee. I asked if she could tell me a bit more about the road closures and when they could expect them to reopen. She said she didn’t know, she hadn’t seen the floods, but heard they were bad. We’d be lucky if the roads could reopen by year end.
Wow, at this point I’m a bit annoyed, but a floods a flood, you can only do so much. She handed me a park map and sent me packing.
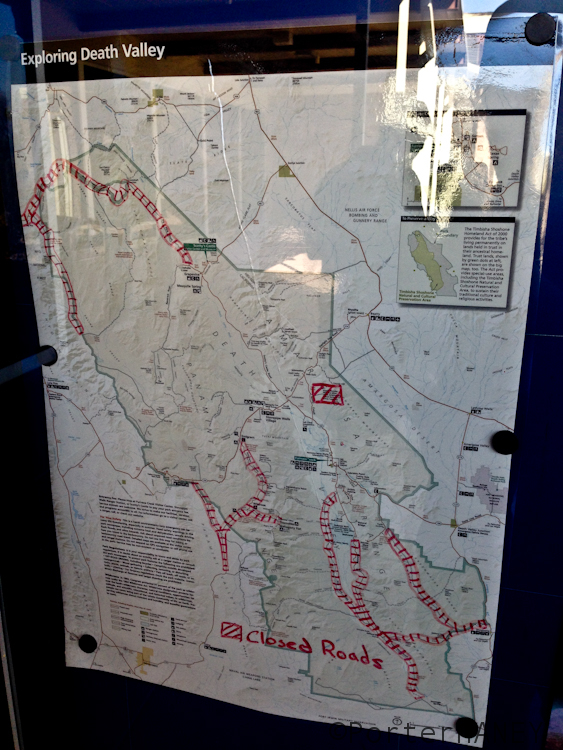
A look at the mostly closed Death Valley National Park.
On the front of the map, is a message from Death Valley National Park Superintendent, Sarah Craighead. I went ahead and read what she had to say, and frankly, I was shocked. It really brought the road closures, the new $10M visitors center, and the current NPS closures full circle.
The park superintendent says, among other things,
“My tenure at Death Valley has been an experience I never could have predicted. I have worked with a wonderful staff who championed many important projects- the most notable being the renovations of the Furnace Creek Visitors Center. This remarkable project transformed the 1959-60 constructed facility, landscape, and interpretive exhibits into a LEED-certified visitor-friendly complex, while preserving its Mid-Century Modern design.”
Since this is in the second paragraph of her message, I read this to say, her proudest accomplishment as a park superintendent is the renovation of a giant building in her park. Not that millions of visitors have seen the wilds of Death Valley, or that they’ve saved millions of acres from mining, or that they’ve opened access to hundreds of backcountry trailheads. No, we should be most proud of the new building we build on public lands with public money.
Her third paragraph goes on to really spell it out for me,
“We also completed the Wilderness and Backcountry Stewardship plan which outlines management strategies for 3.2 million acres of wilderness and backcountry within the park. The plan formally proposes actions that will be implemented in much of the park for the next 20 years.”
Wonderful, instead of actually preserving the park and working to maintain open access to the park, they’ve been building a plan about how they might handle park management.
At this point I was really fired up. I’ve worked in a National Park before and understand all of the bureaucracy that comes with trying to do the right thing in a situation like this. But this really rubbed me the wrong way.
The park superintendent is advocating for their newly developed visitors center project, has all of her rangers managing it’s front desk, and can’t be bothered to address when they might open up access to closed public roads.
I was annoyed by all of this, but it wasn’t until the recent National Park Service closure due to the Federal Government not passing a new budget that I really felt obliged to speak out.
I’ll be honest, my first thought when I heard the parks were shutting down this morning was: This is awesome – National Park roads will be open and there won’t be any rangers around to tell the tourists how they’re supposed to enjoy their public lands. Maybe even all of their “closed roads” will be open for the public to explore.
I hopped in my car this morning, and went to explore Red Rock Canyon National Conservation Area, the closest National Park Service managed public land to my house.
We got out to the park, and I anticipated all services would be shut down, no employees on duty, and open access to the park.
Well, I was half right. All the services were shuttered, and non-essential personnel were sent home.
It turns out essential personnel were still there. And those essential personnel were Park Rangers armed with assault rifles, wearing bullet proof vests, and blocking access to the park road. So the parks didn’t just “close” during this Federal Government shut down. No, instead the Parks are paying federal employees to stand around at the entrance gate, dressed like commandos and enforcing a closure.
It doesn’t sound so much like a park closure as it does as the government restricting the public access to their own lands.
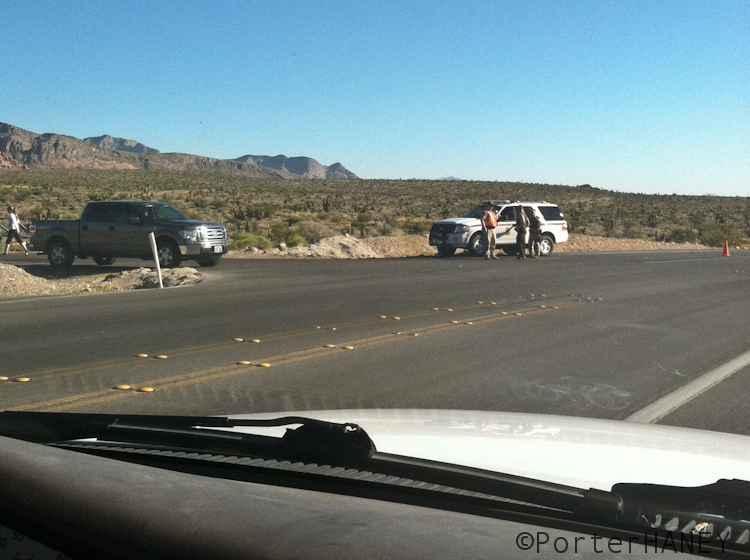
NPS rangers keeping the park “closed”
I don’t know about you, but I don’t think blocking tax payers from access to their lands is a good use of Federal dollars. No better than a park that’s half closed and spent all of their budget on a Visitors Center instead of ensuring public access to the public lands. In fact, these public lands were designated public, and to not be developed. The National Park Service’s sole job is to manage these lands. If the National Park Service is relieved of their duties, or elects not to repair a flooded road, than these lands should remain public and open. Right now it’s the exact opposite, we’re paying rangers to enforce that they remain closed.
With nothing left to do, and no way in the car past the armed rangers, we protested the only way we knew how. We walked into the side entrance of the park, and enjoyed it in it’s most pristine state I’ve ever seen.
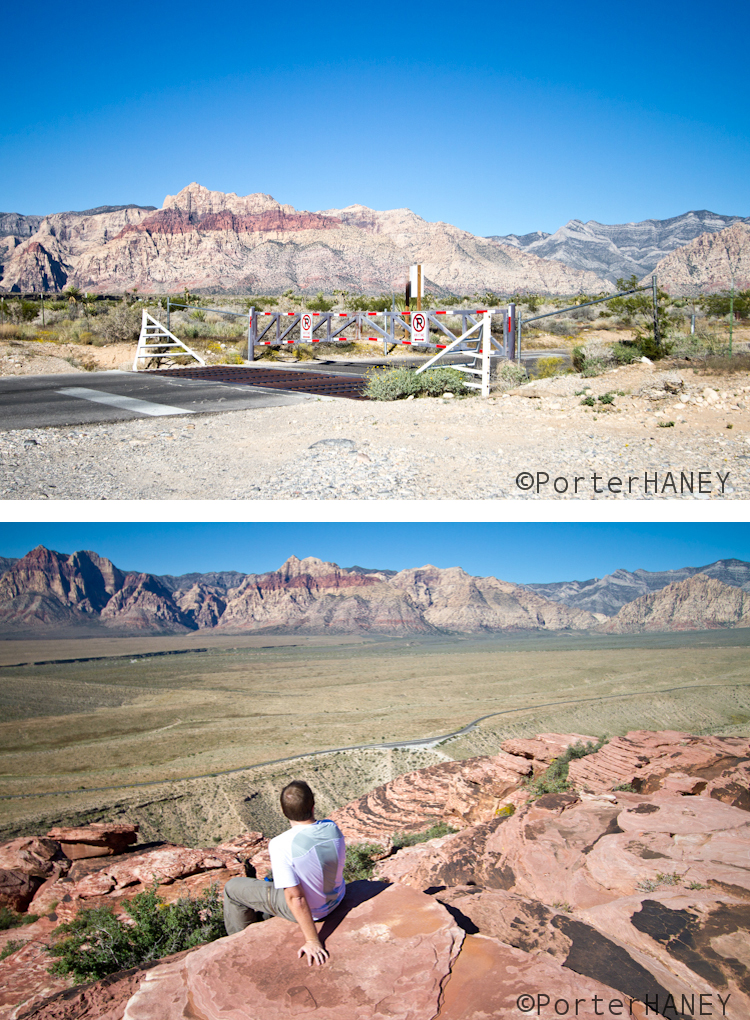
Jimmy enjoying the wilds of Red Rock Canyon
I hope you too get to enjoy our National Parks while they’re closed and in their wildest state.
This is definitely a touchy issue, if you have an opinion I’d love to hear it in the comments below.
Steep Jugs! (5.9)
Greg and I are pretty stoked with our accomplishments as of late. After picking up climbing a few years ago as a summertime recreational endeavor that is perhaps the perfect antithesis of our other ballistic sports, we’ve gone on to achieve the following:
- We barely know how to climb (this is an accomplishment BTW, since not long ago we didn’t know how to climb).
- We’ve had almost zero beta on anything we’ve ever climbed aside from some hastily drawn and/or purposefully vague and/or out-dated topos we’ve stumbled across here and there on the Internet and in a few GREAT books.
- We’ve survived.
- We have somehow managed to put up a 2 pitch moderate sport route in Smuggler’s Notch this summer. It’s called Steep Jugs! (5.9) and you should go climb it.
Here’s a timeline of the route’s history:
8/25
Day 1; the first bolt hole.
9/7
After a couple weeks of small weather windows, pitch 1 is (mostly) bolted and ready for a send! Climb time, FA of pitch 1.
“I’m not so sure I’m ready for this, man.”
According to Greg – “i think there’s a good spot for a cam up there” – P., there was supposed to be a cam placement here.
“Really dude?!”
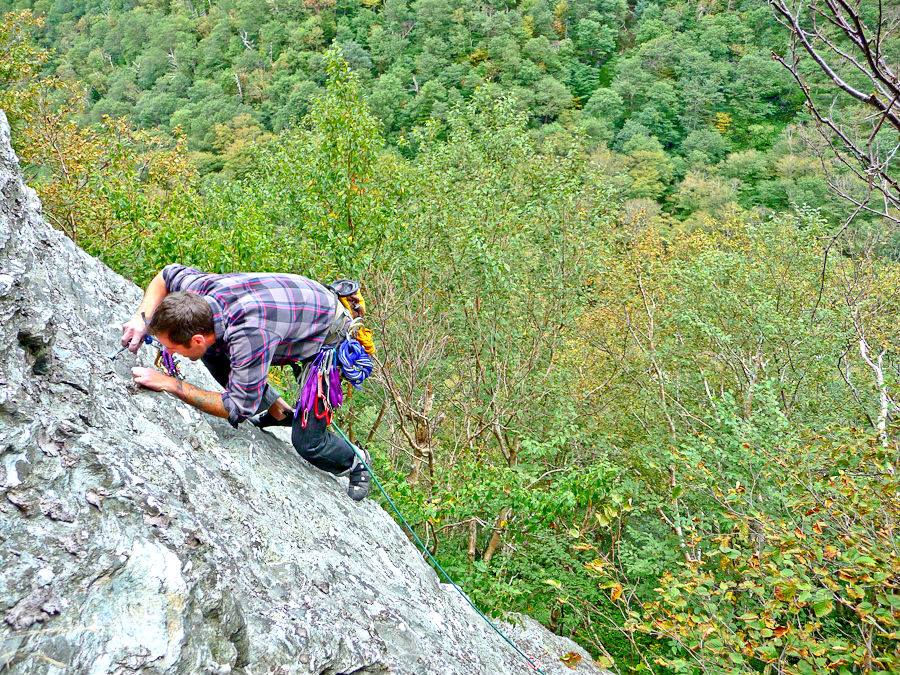
“No, dude! Whatever, we’ll stick another bolt in here next week.”
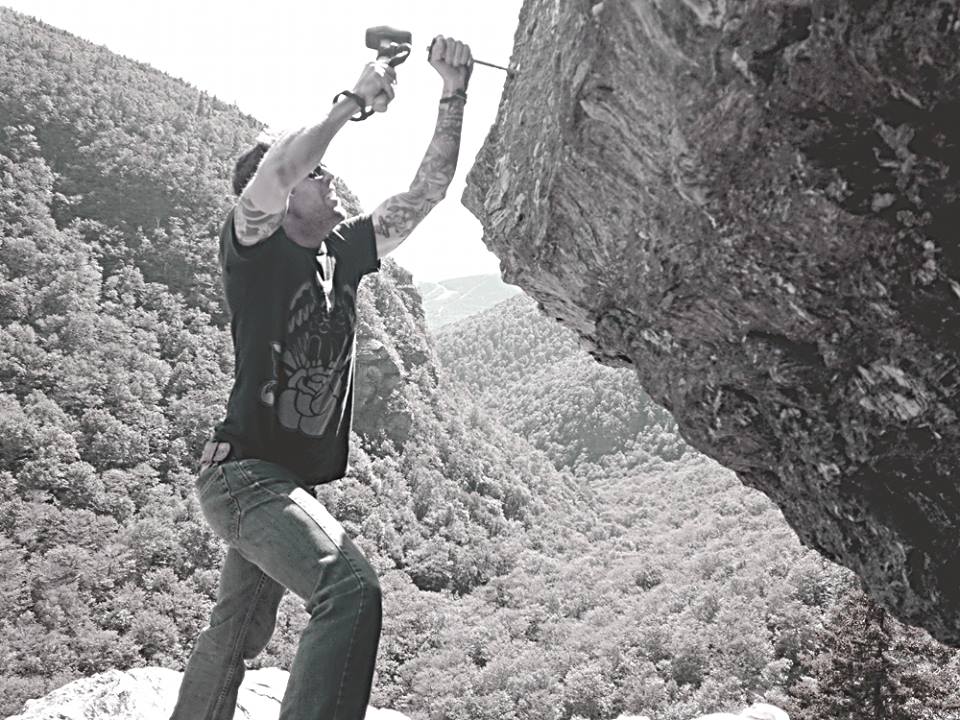
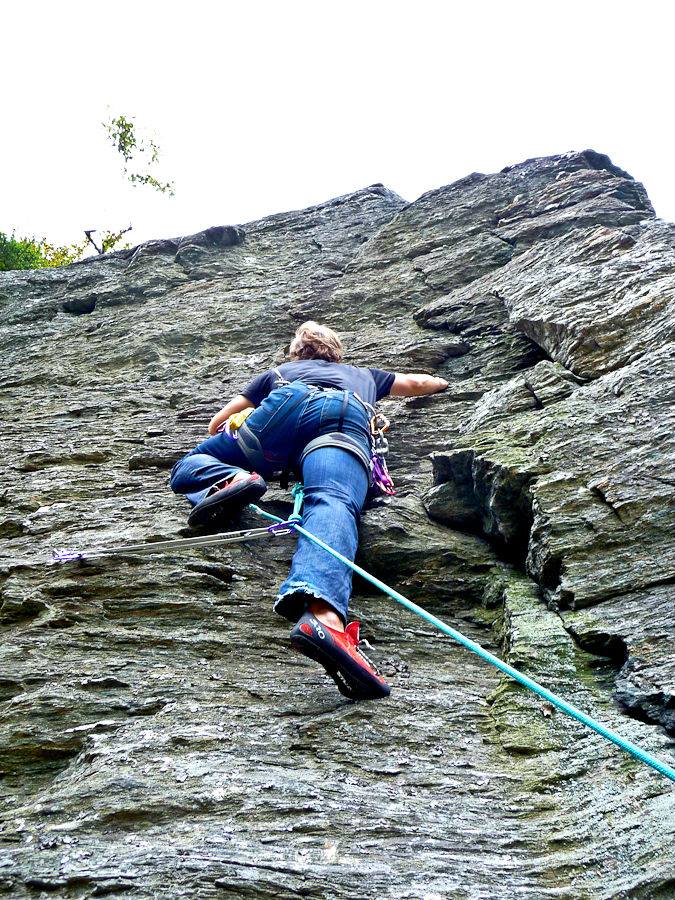
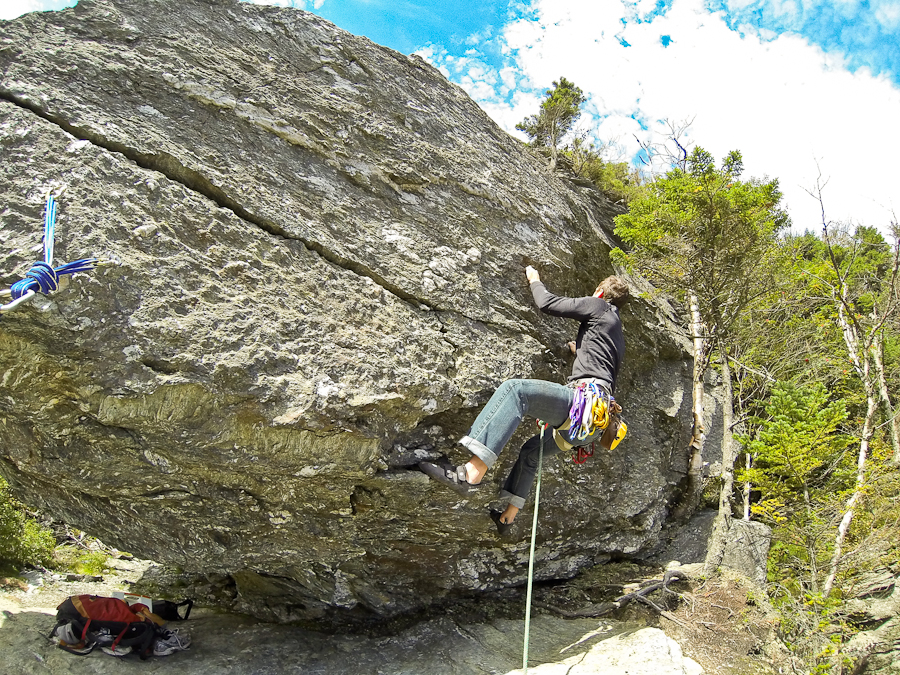
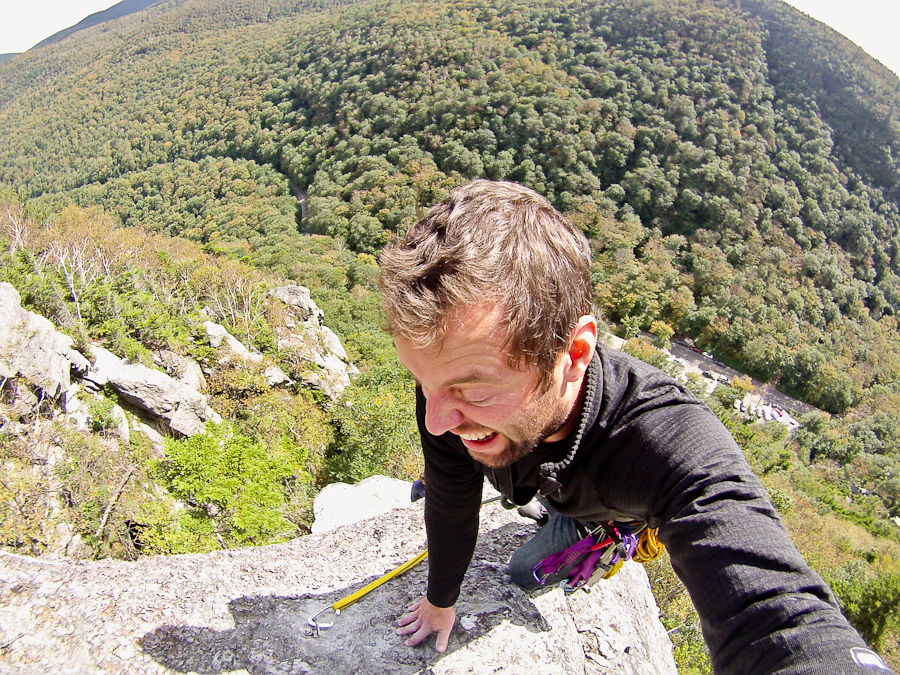
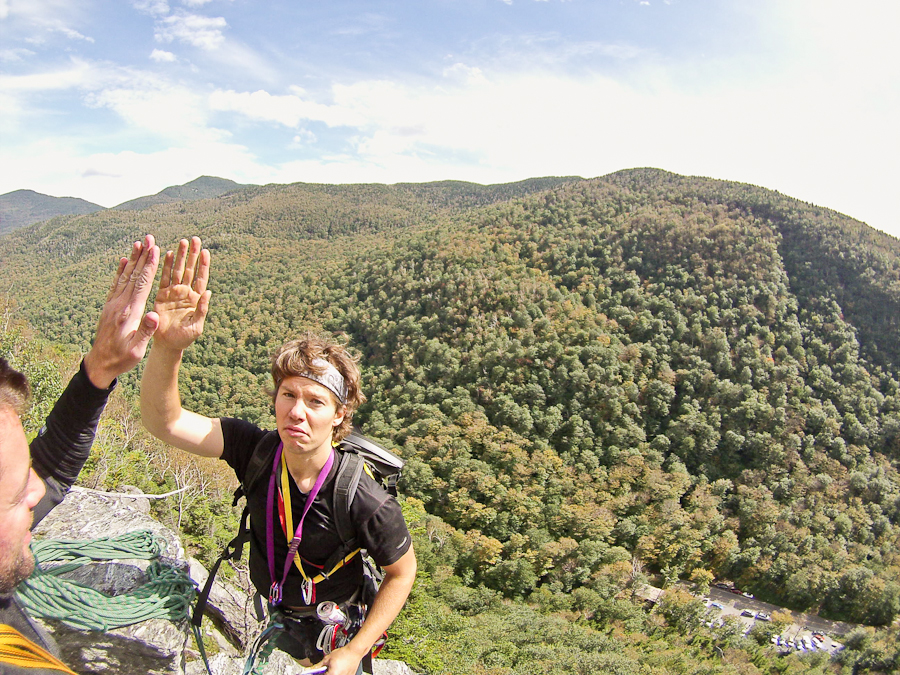
Here’s me taking on the face that gives Steep Jugs! its name for the first time.
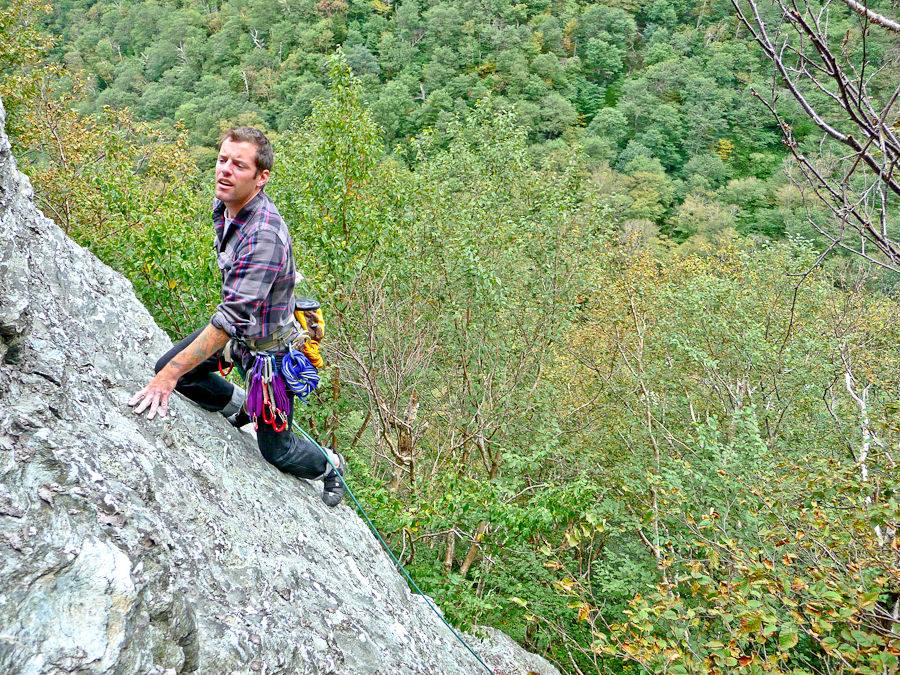
Here’s Greg before he tries it himself. I think he got the impression it was easy. He struggled a little bit through the crux (typical).
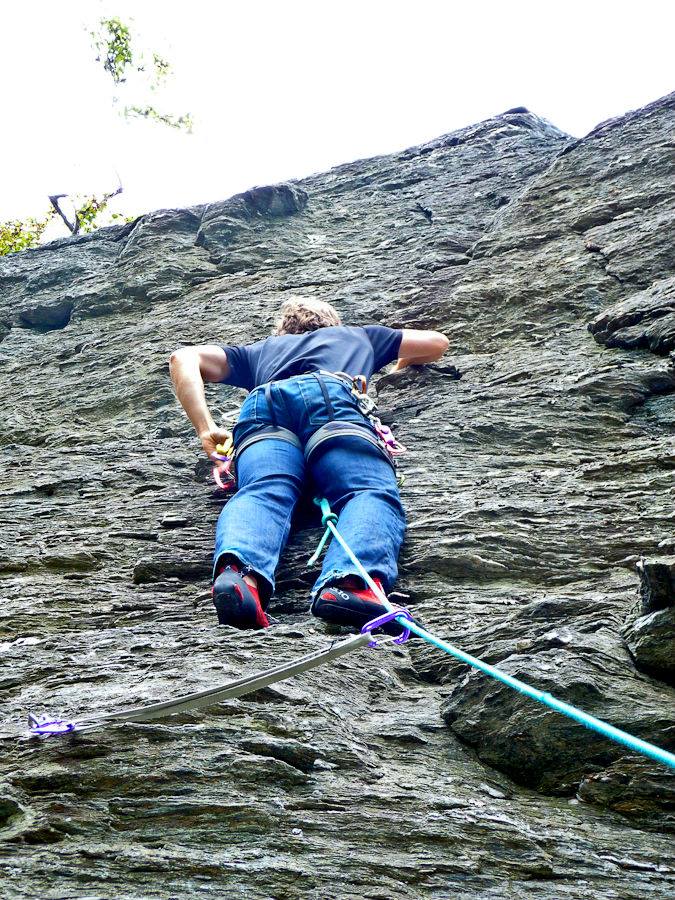
Here’s Greg working into the crux…
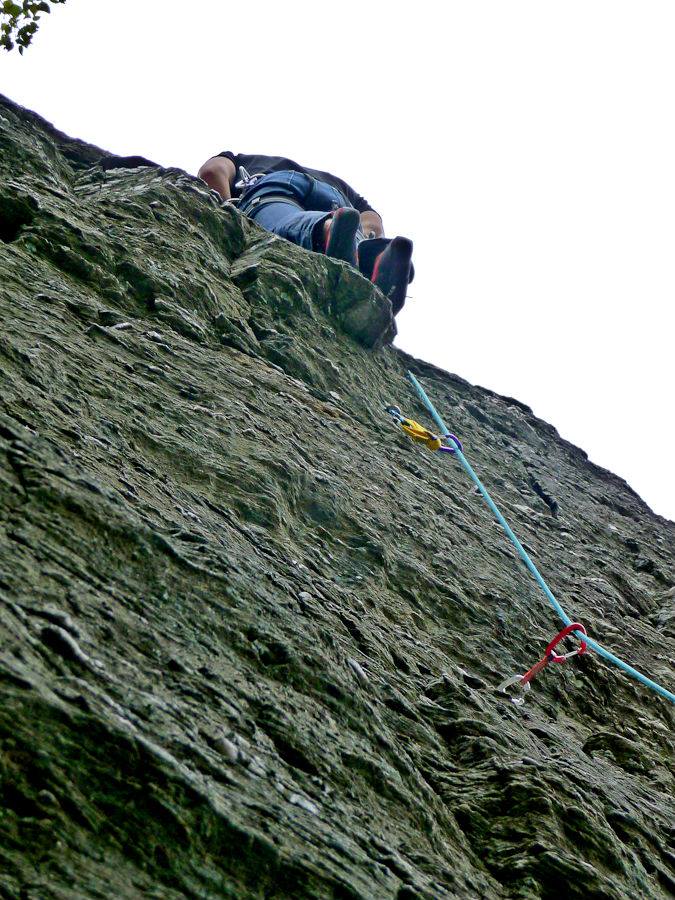
…and clipping bolt 5…
…and then finally standing above the crux and perched on “the beer ledge” (so named because he rested a beer can while drilling the bolt hole below it).
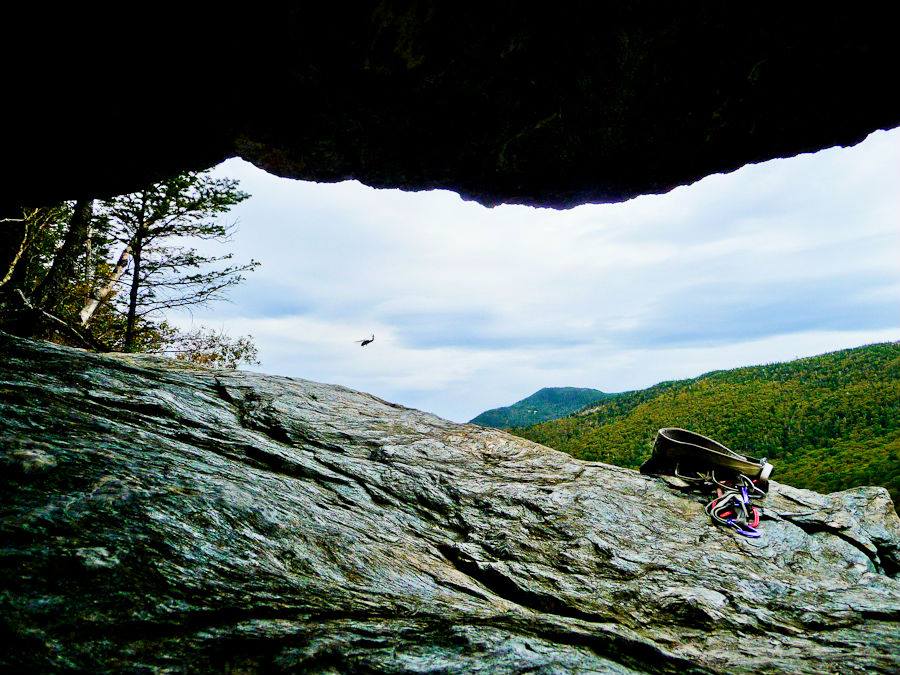
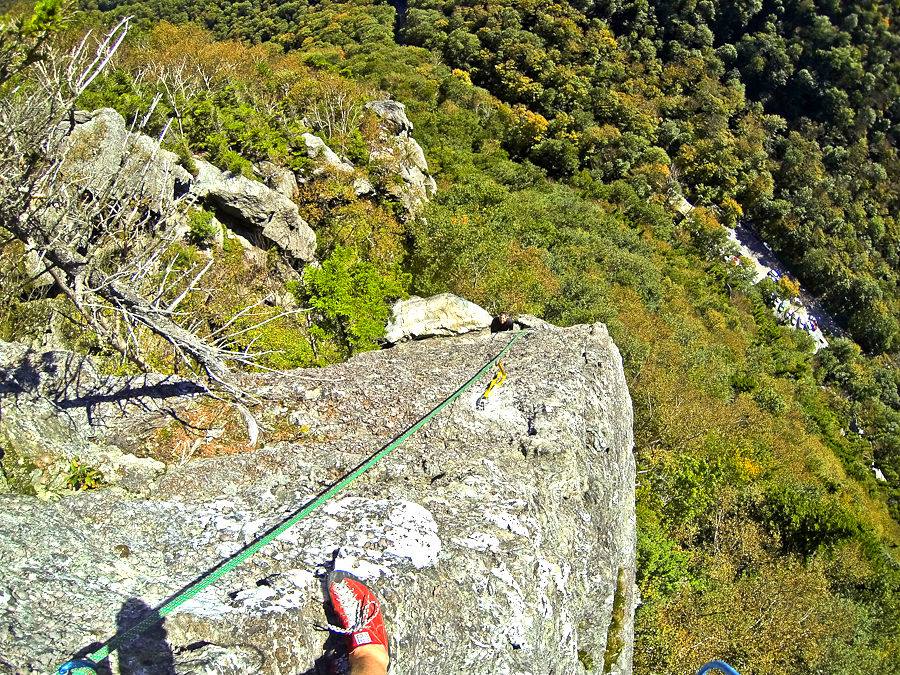
And then finally here was our view from the top of P1. in the bat cave after our first ascent(s). Apparently someone told the Air National Guard we were doing some “big deal” stuff, and they clearly were doing a flyby to get some shots from the chopper. (look for those later ;) )
It felt great to climb what we had put so much sweat into, and get what was likely a first free ascent, but we still had more work to do. We had only finished bolting one pitch, and were envisioning another higher up the face into territory we doubted anyone had even considered climbing before.
9/14
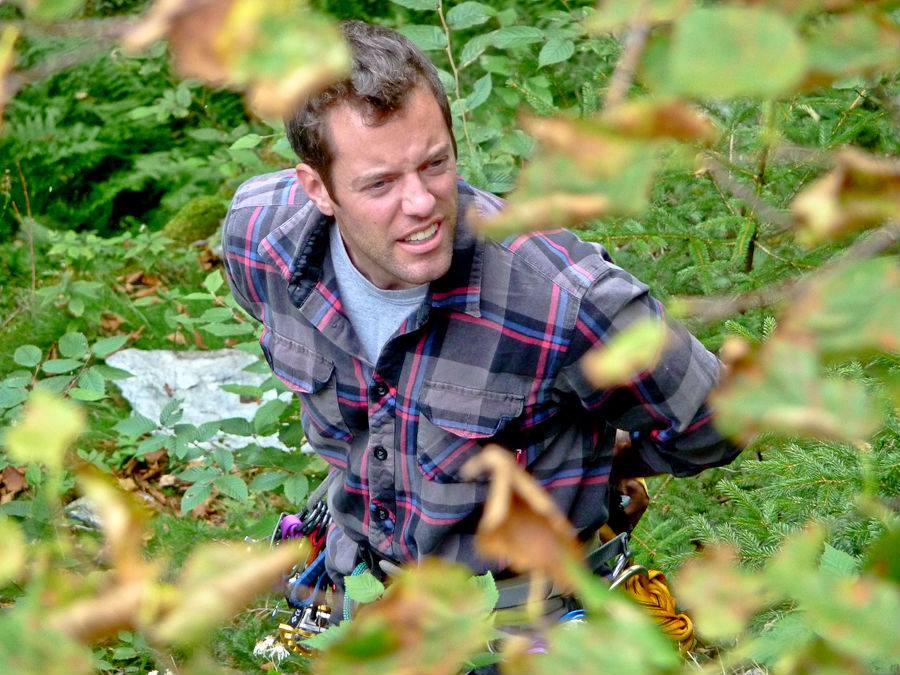
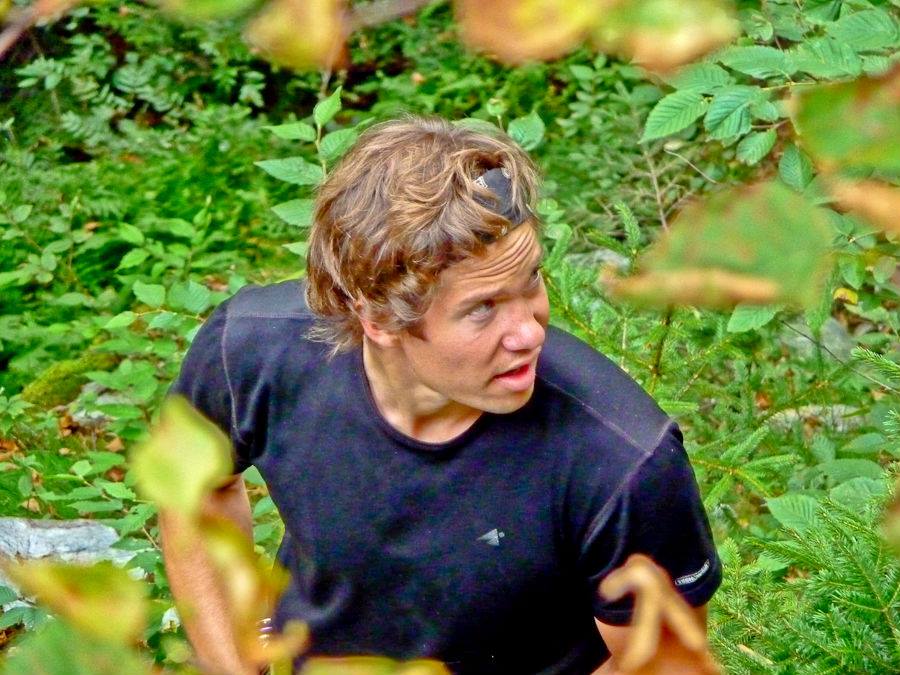
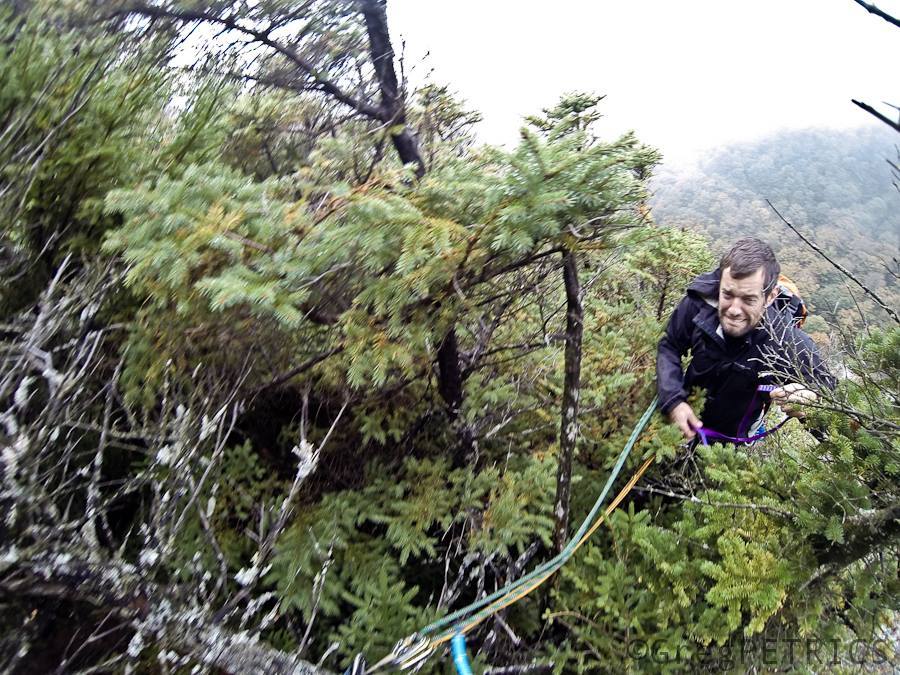
After a week of work, we went back, and thrashed our way to the top of P2 to start drilling the climb. Here’s me rapping out of the woods to bolt the second pitch. cold, wet and scared is no way to go through life… or maybe it is.
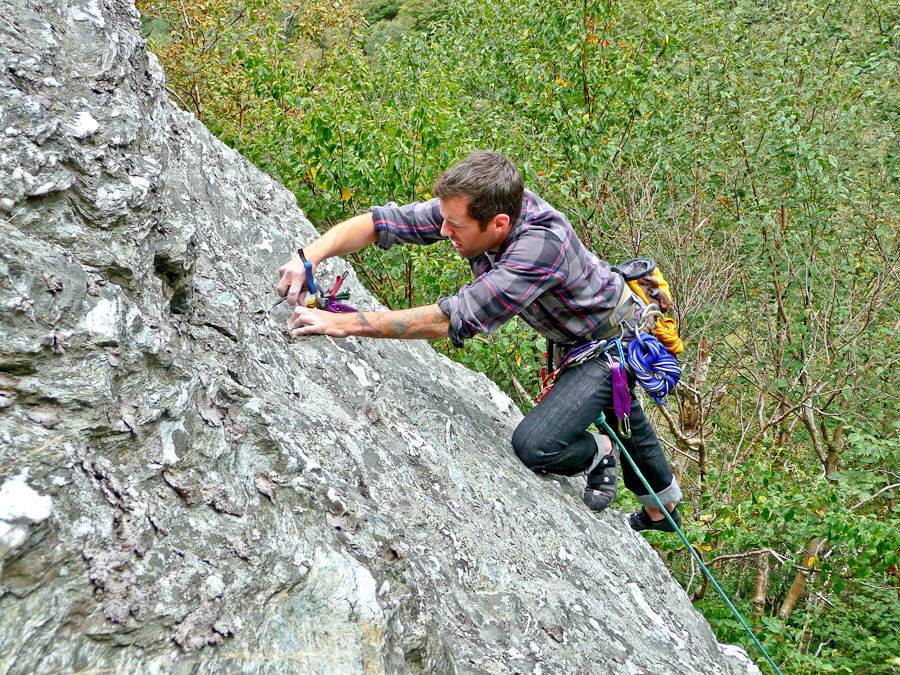
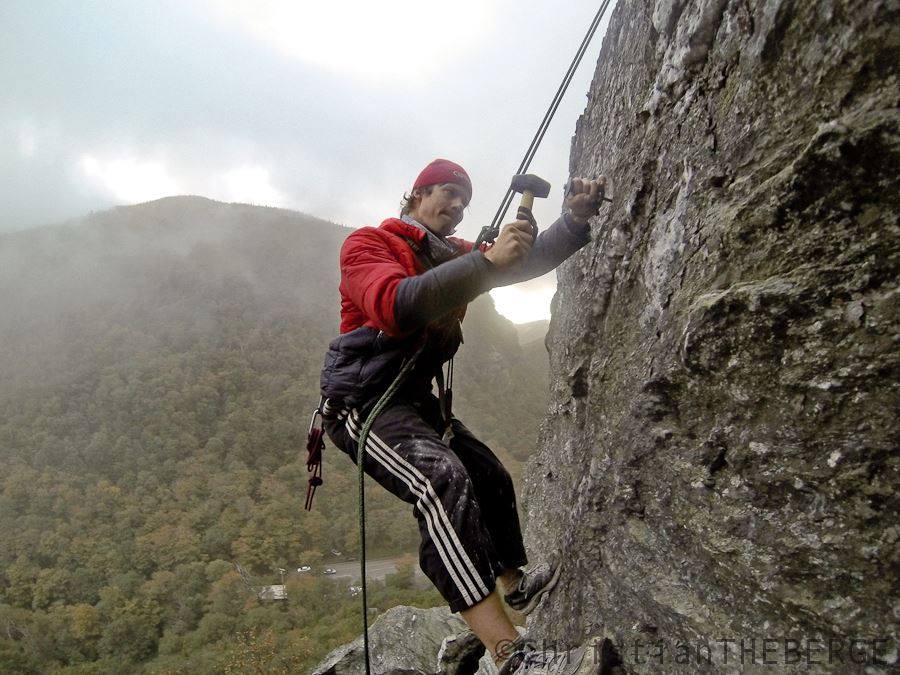
Here I am hanging on the two bolts Greg just put in above me (from where the picture is taken from) hand drilling on the arête. There’s not a much stronger affirmation of trust than this.
And then finally here’s Greg drilling the last bolt of our climb… 5 feet from the first one!
The sweet taste of a job well done… and a PBR… and ground up schist in your mouth.
9/15
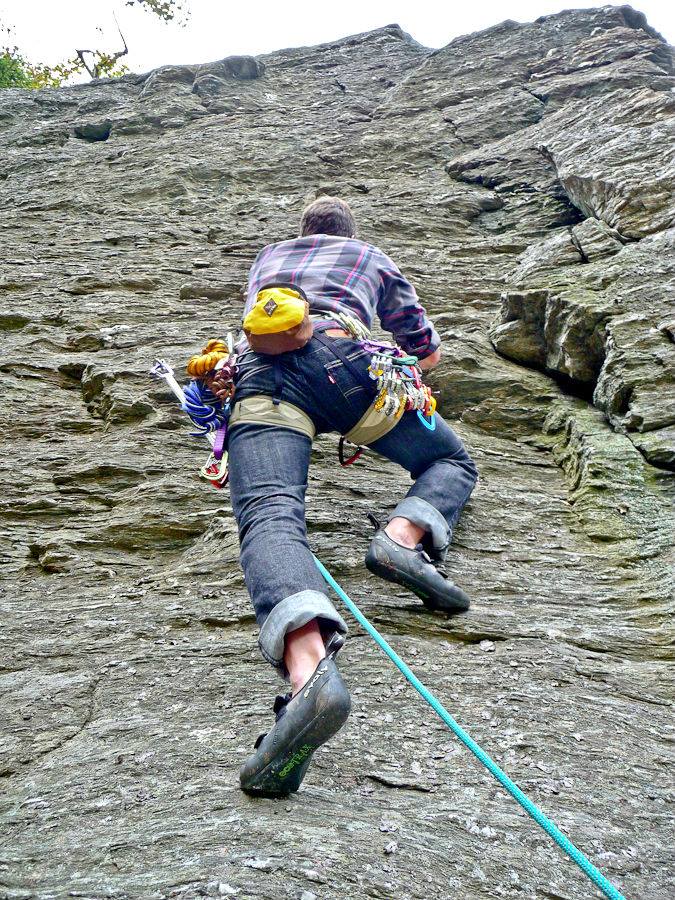
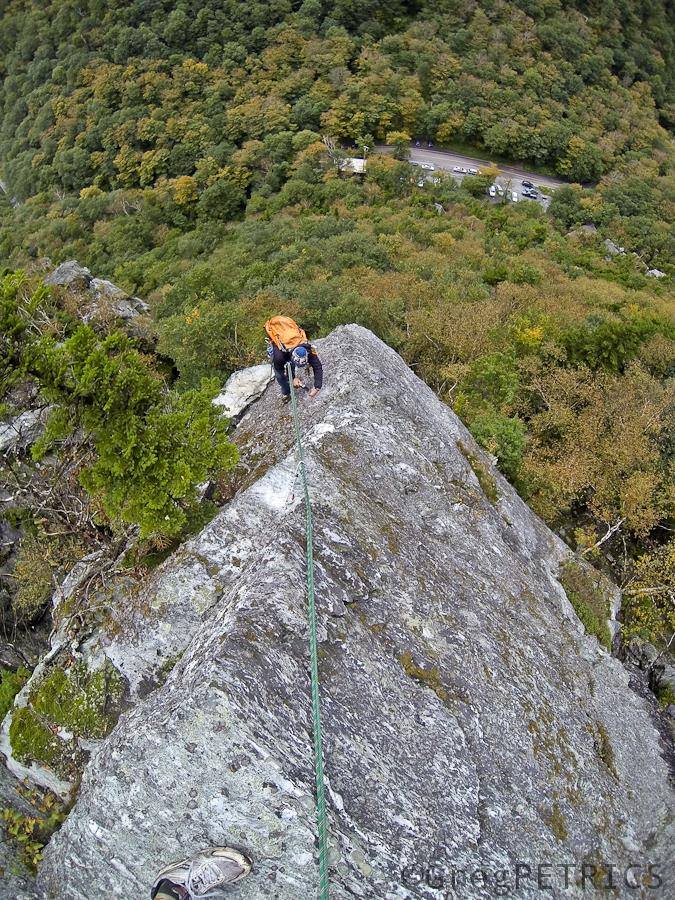
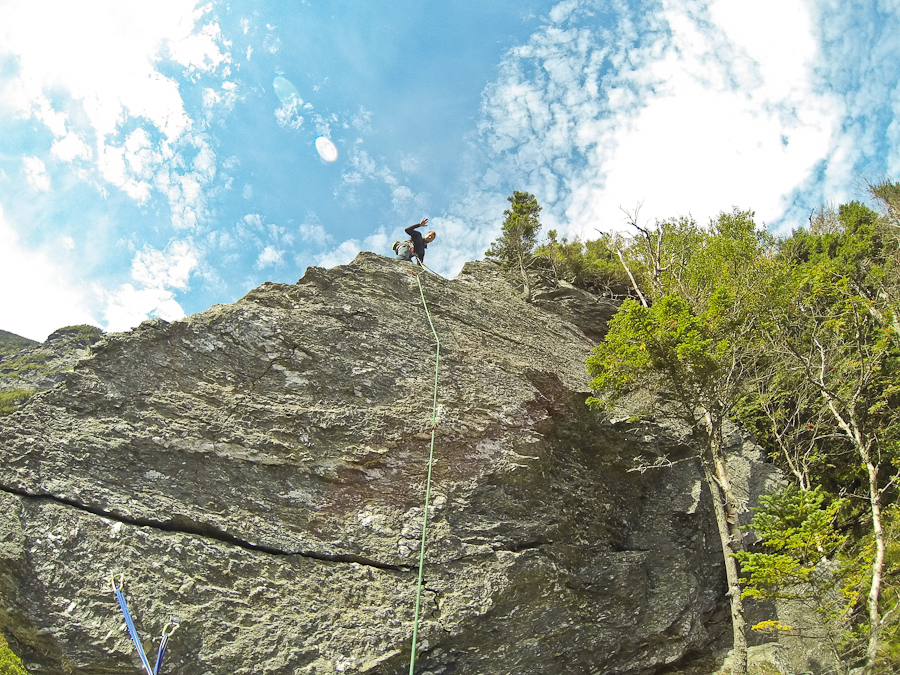
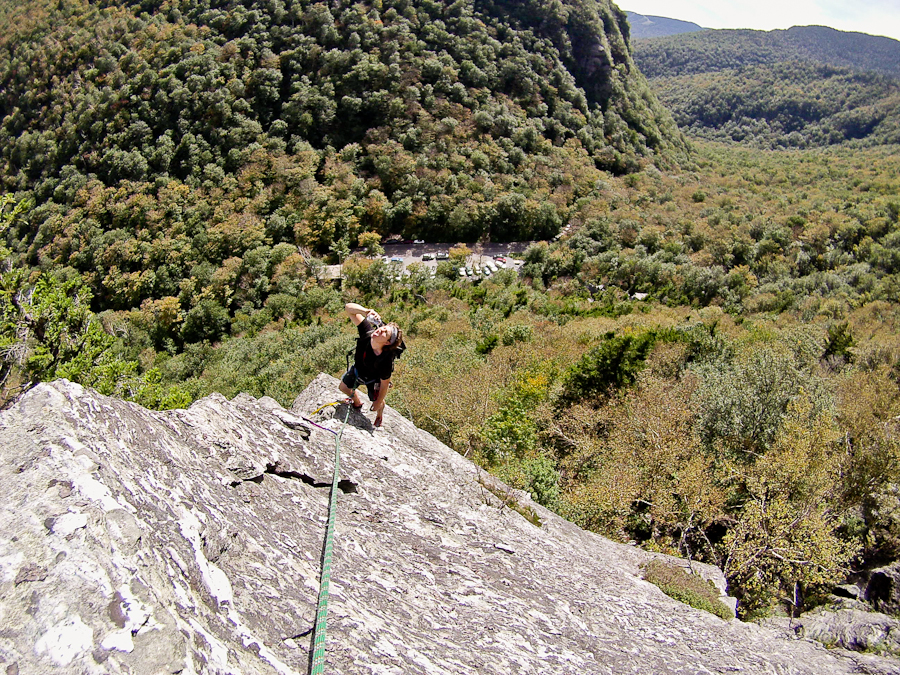
After a night spent licking our blistered hands, we returned on a glorious Sunday to climb what we’d just poured some sweat into. Here’s Greg on the FA of the second pitch! If only I had a picture of him shaking like a tuna trying to complete the mantle crux near the bottom.
I guess he’s showing the mountain he can climb it and look awesome doing it. Or not.
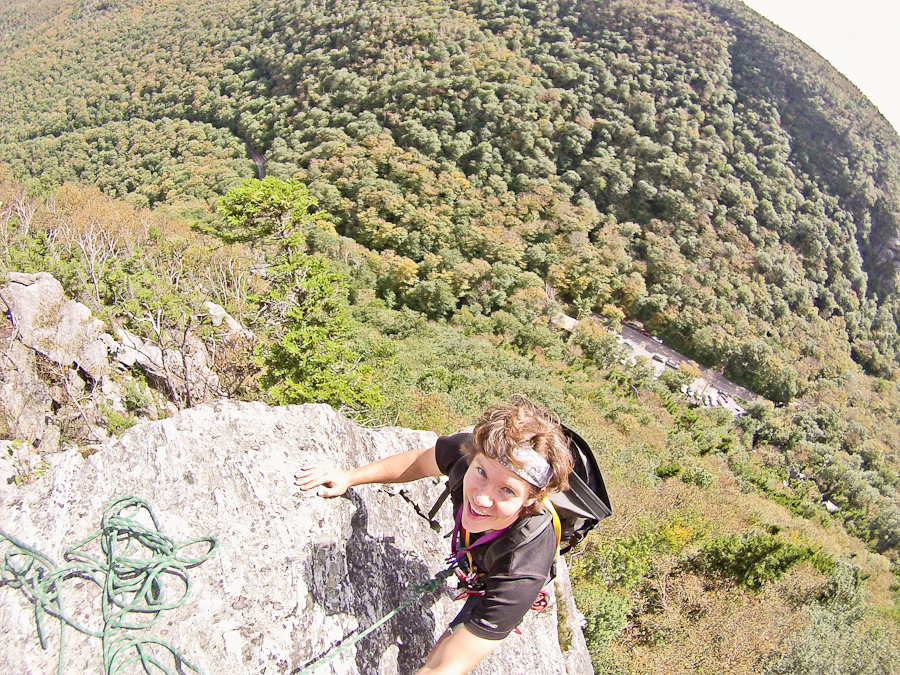
After slapping the top of that bad boy, Greg rapped down, pulled his gear, and handed it to me with no beta so I could get a try as well. Here I am getting off the ground on the second ascent… and thoroughly wishing I had payed more attention when Greg sent it.
Oh hai! I upgraded your notch.
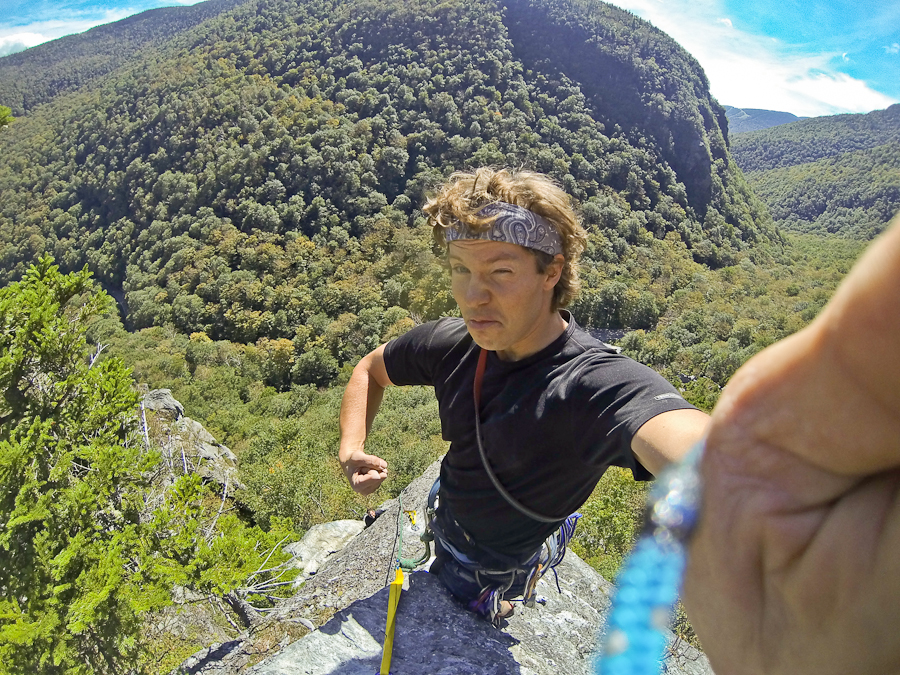
I’m not sure why I do this to myself, but here I am happily standing (and by that I mean shaking) on the wild arête that brings you to the top of P.2
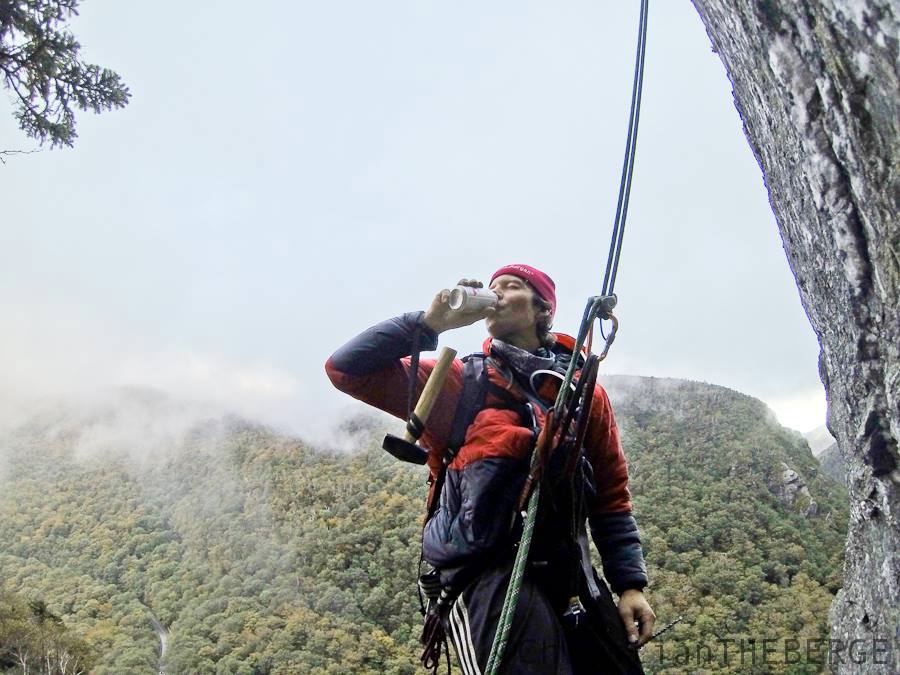
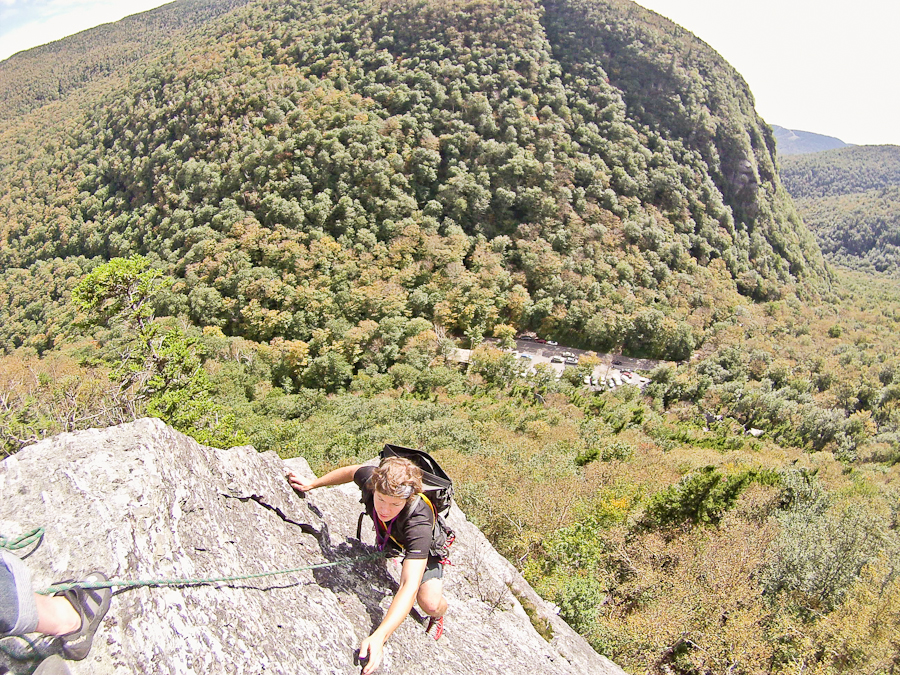
This is Greg on his second ascent of pitch 2. Notice his elegant technique, stopping to refuel on his way up!
Here he is taking on the last tricky move before the top.
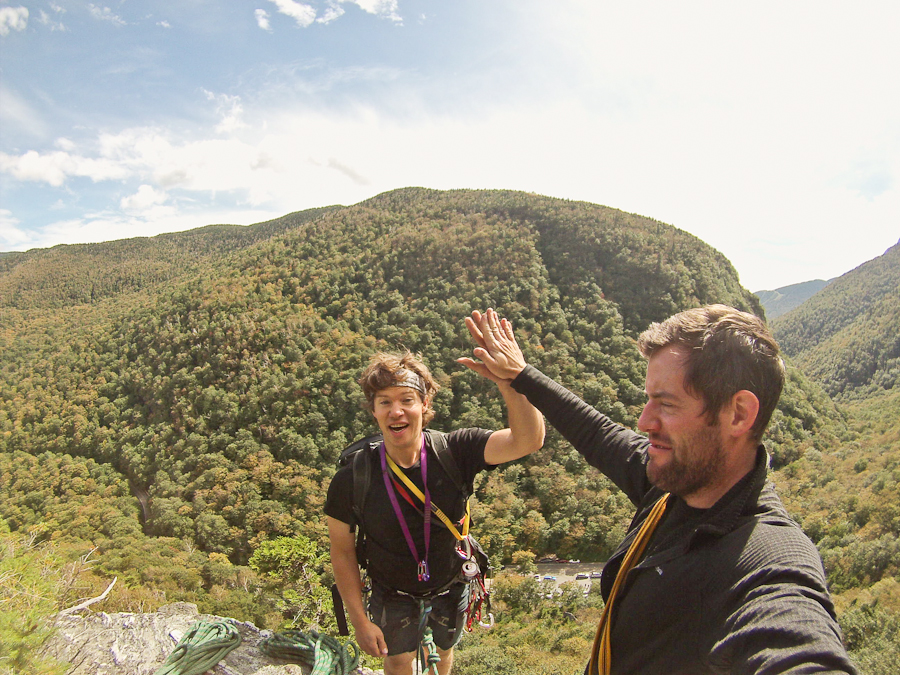
Finally, both of us standing on top of what we had poured a lot of energy into. Greg’s face says it all. Wait… maybe not.
There we go. That’s better. Hanging and enjoying on what is the best party ledge in vermont. Hands DOWN! Or is that Hands Up? IDK
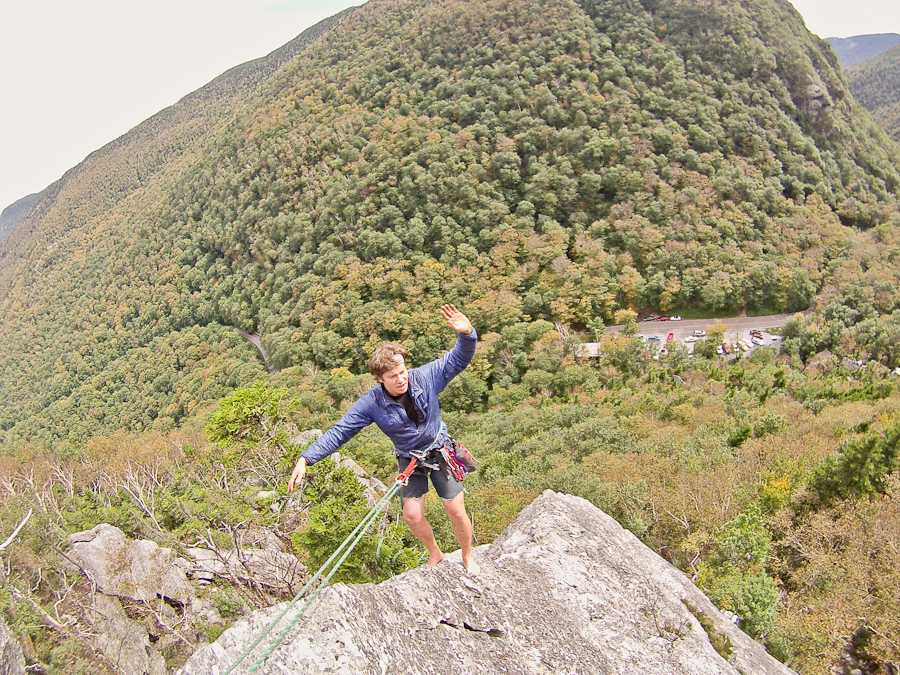
And on our way down, Greg also nabbed the FBHSDR (First Barefoot Hippy Spirit Dance Rappel). How do you spell your last name dude? I’ll write it down and send that info to Travis…
Thanks to everyone who has ever helped out, gave us pointers, lended us gear, gave us gear, stoked us by showing us what is possible, and who supported us with some high fives and/or beer! It’s been very fun, and we really appreciate it. Here’s a list of you guys in no particular order: Nick, Jeremy, Bill, Mike B., Dwayne Hayne, Porter Hayne, Ben Peters, KC, Chrisil, Travis Peckham, AJL, Rog K., Gerard, Dave Powers and more. Thanks!
Now, hopefully this route will be as enjoyable for everyone else as it is for us! We’ll get a topo put up on here in a day or so, but for now check out the route description on Vermont Rock.

-
Search
New Comments
Surfing Safari on Burlington's Booth Street | Seven Days said: “[…] lights and snapped away. Here’s a...(read more)” about Surfing the Flood
macbook repair seattle said: “macbook repair seattle Let’s get it started...(read more)” about Let’s get it started
Greg said: “Thanks for all this great info. And...(read more)” about Skiing Mt. Colden’s Trap Dike
Greg said: “Definitely late, but always welcome!” about Skiing Mt. Colden’s Trap Dike
Bob said: “[* Shield Security plugin marked this comment...(read more)” about Skiing Mt. Colden’s Trap Dike
Regular paint Maintenance said: “Regular paint Maintenance Behind The Schuss(ic) :...(read more)” about Behind The Schuss(ic)
The 2012-13 Ski Season in Photos #13 | NY Ski Blog said: “[…] tweeting about big Memorial Day snow...(read more)” about pow
ml242 said: “LuckyLuc and MadPat on the same day?...(read more)” about Deep Cover Anthropology
Twitter Feed
-
Categories
- Skiing (438)
- Weather (188)
- WTF (5)
- Quick Update (173)
- Full Trip Report (165)
- WebiGNARs (45)
- General Interest (38)
- Site News (27)
- Summer (59)
- Hiking (26)
- Swimming (15)
- Climbing (13)
- Longboarding (3)
- Whitewater Kayaking (2)
- Mountain Biking (1)
- SPA (16)
- Gear Review (8)
-
Archive
- October 2018
- June 2017
- November 2016
- October 2016
- March 2016
- January 2016
- October 2015
- February 2015
- January 2015
- December 2014
- November 2014
- October 2014
- September 2014
- July 2014
- April 2014
- March 2014
- February 2014
- January 2014
- December 2013
- November 2013
- October 2013
- September 2013
- August 2013
- June 2013
- May 2013
- April 2013
- March 2013
- February 2013
- January 2013
- December 2012
- November 2012
- October 2012
- September 2012
- August 2012
- July 2012
- June 2012
- May 2012
- April 2012
- March 2012
- February 2012
- January 2012
- December 2011
- November 2011
- October 2011
- September 2011
- August 2011
- July 2011
- June 2011
- May 2011
- April 2011
- March 2011
- February 2011
- January 2011
- December 2010
- November 2010
- October 2010
- September 2010
- August 2010
- July 2010
- June 2010
- May 2010
- April 2010
- March 2010
- February 2010
- January 2010
- December 2009
- November 2009
- October 2009
- September 2009
- August 2009
- July 2009
- June 2009
- April 2009
- March 2009
- February 2009
- January 2009
- December 2008
- November 2008
- October 2008
- April 2008
- March 2008
- February 2008
-
Friends of F.I.S.
About Us:
We are a group of powder hungry, east-coast-bred, world-traveling skiers and riders who Earn Our Turns to bring you the best stoke a click-of-the-mouse can buy.We hope our adventures inspire you to Earn Your Turns as well!
LEARN MORE

Latest Weather
When one makes meatballs, one must begin with quality meats: ...
Read more in: Meatballs! (read more)